Wolfe Waves and ABC’s
Ok. My lazy butt saw something, and I had to get out the laptop to show you my vision.
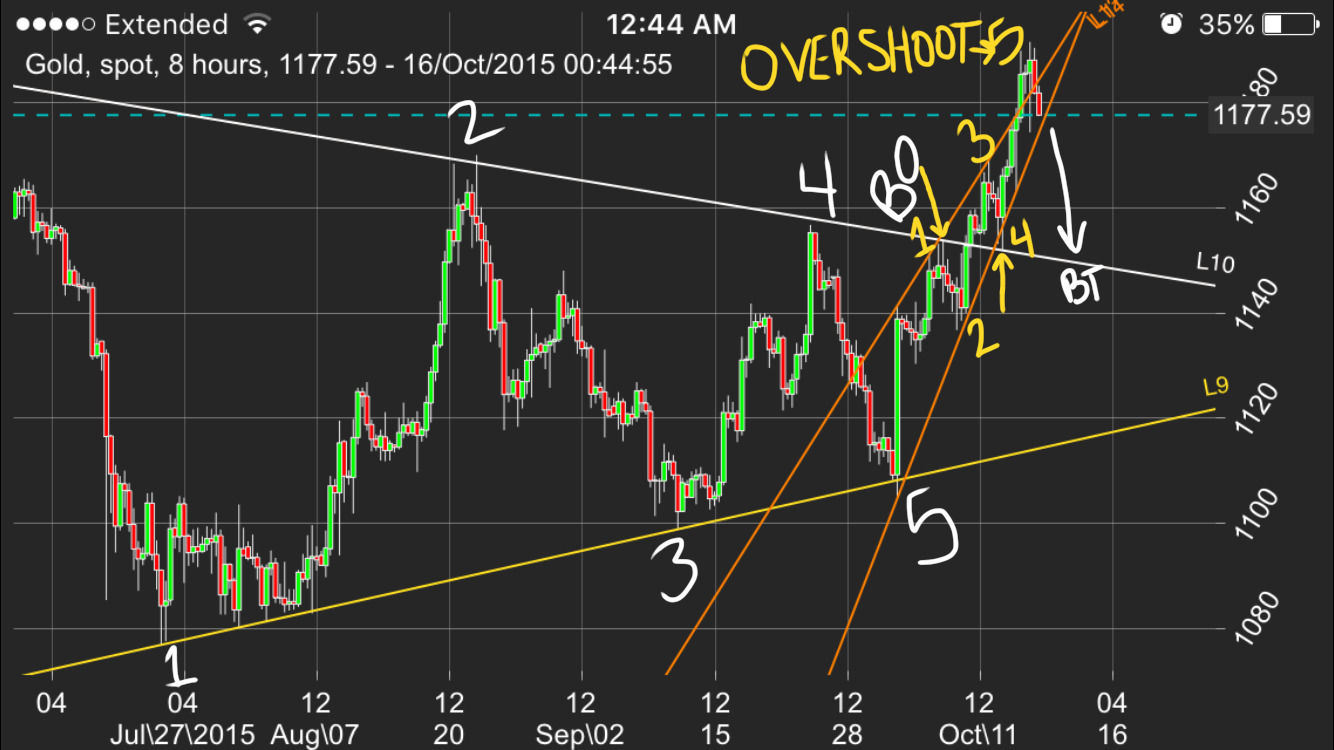
Above: Look at the white line. It’s the top rail of the triangle gold broke out from right? NO. It’s the Wolfe wave pullback target line connecting the 1 and 4 where the yellow arrows are pointing. The Wolfe wave target line and the top rail of gold’s recent triangle are almost identical. A Wolfe wave pullback brings gold back to about $1150.
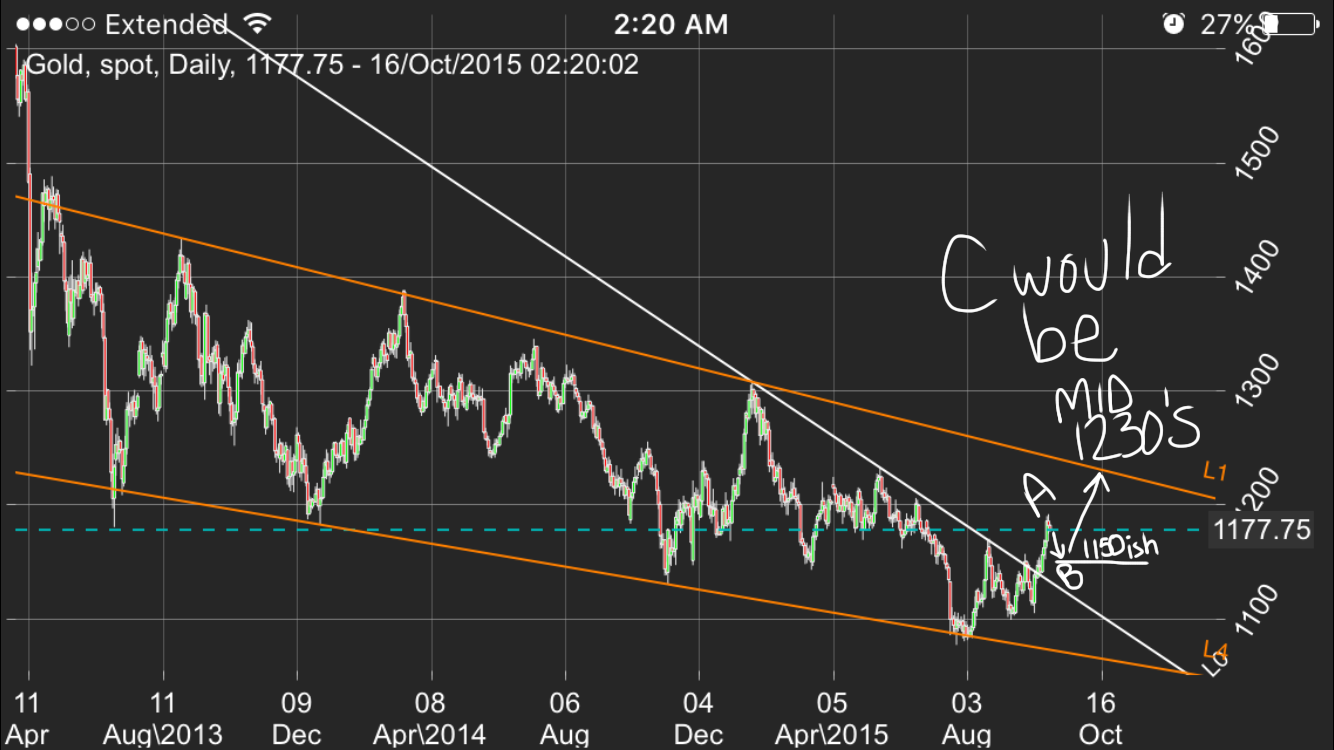
What if the pullback is just a backtest of the triangle and a Point B for an ABC Move? Well the math says Gold would then go up to the mid $1230’s as shown below.
Well this just happens to be right at the top rail of the major consolidation pattern gold has been in for eternity…
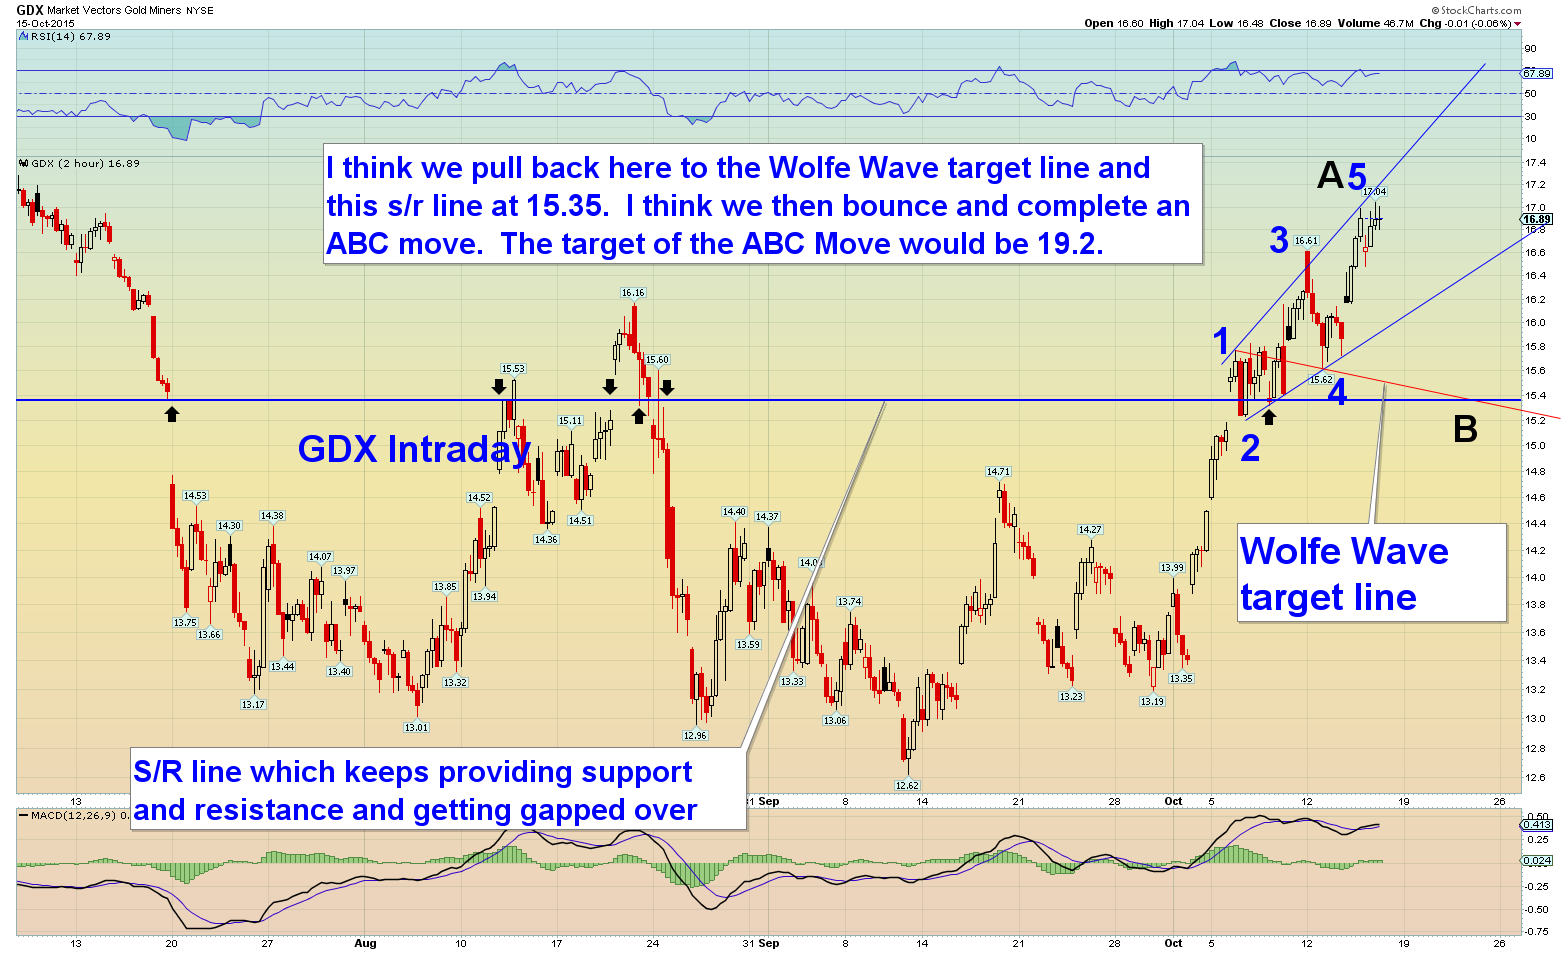
If gold goes to $1150ish then 1230ish, what would GDX do? How about go to its Wolfe wave target which would also be a hard backtest of the gdx double bottom breakout.
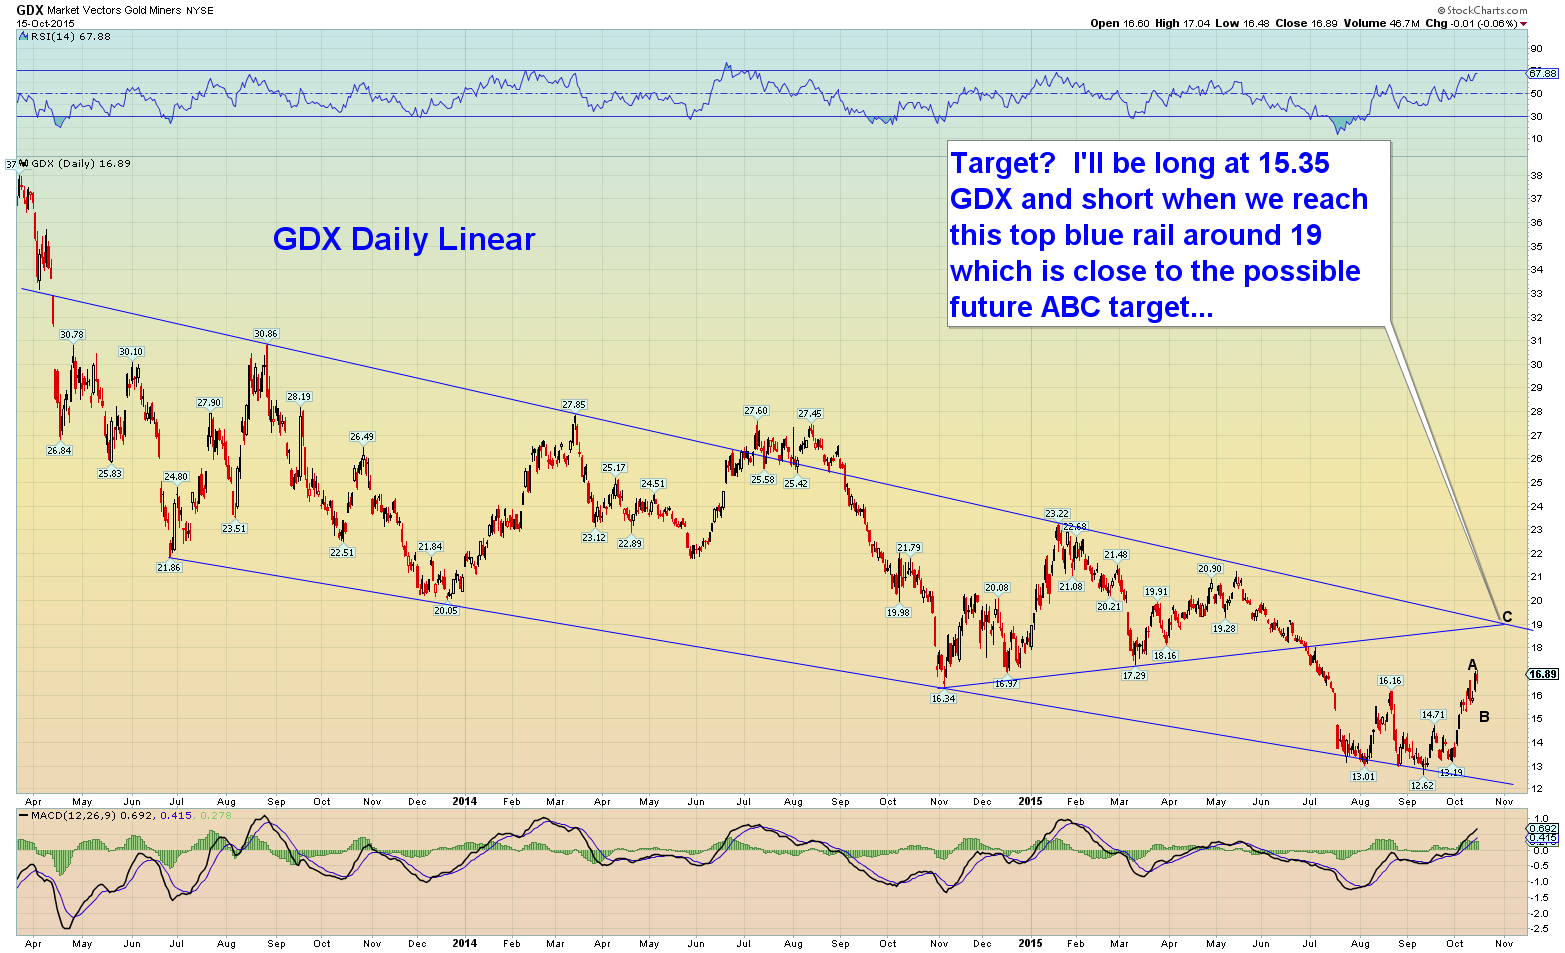
What if this Wolfe wave target is a Point B in an ABC move? Well then GDX would then go up to the low 19’s.
What just happens to be there? A major s/r rail and top rail for gdx as seen below.
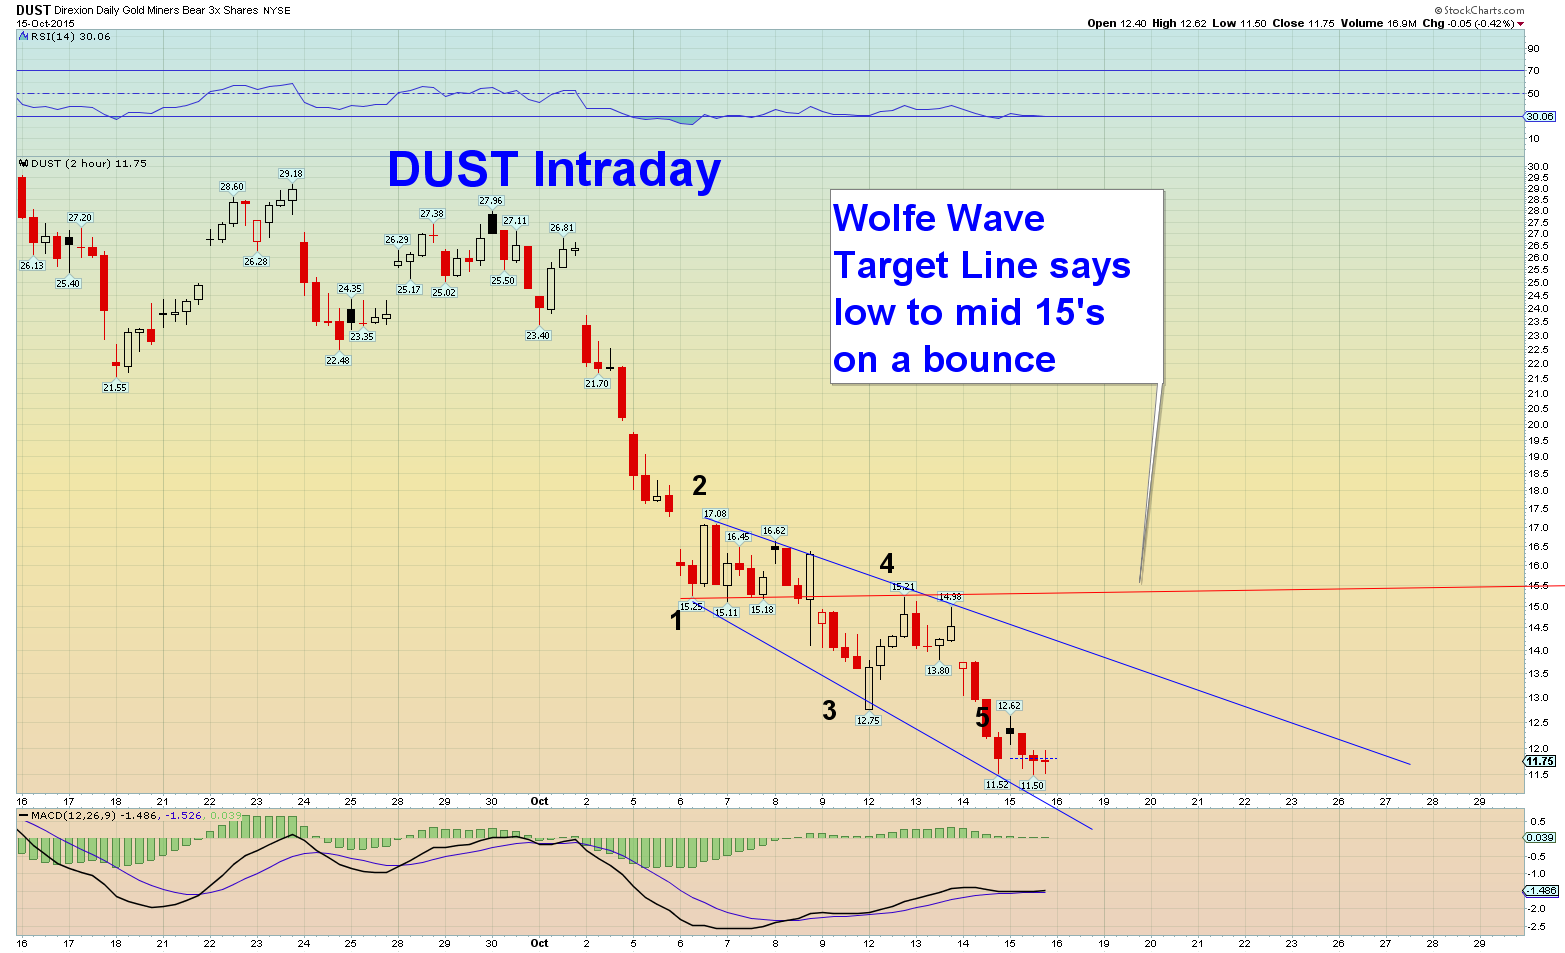
If all this happens what would DUST do? How about go up to its Wolfe wave target in the 15’s for starters.
Below is Sir Schism’s amazing chart from earlier today. He shows that we’re in the bounce zone, due for a bounce which matches up with this analysis and he has his ultimate target for DUST lower which also matches this analysis….
Well a bounce here and then a drop to his target line which, depending on when it gets there, will take DUST to around $8 ultimately give or take.
From there, I think the bear would resume.
I have to give credit to Sir Schism for helping me form some of these ideas. He told me about his idea that we go up to the $1230-1240 area a long time ago, and yesterday he showed this DUST chart below. He told me his upward target for gold before Mark started seeing the same possibility.
Will this all happen? Maybe, but probably not… 🙂 Expect the unexpected…

Chuck – I like this analysis. I actually think the DUST bounce will be a bit higher and will at the top shortly.
I meant “will post at the top shortly”.