UVXY
I like it long at this level. Simple to keep a tight stop. Perfect risk/reward long.
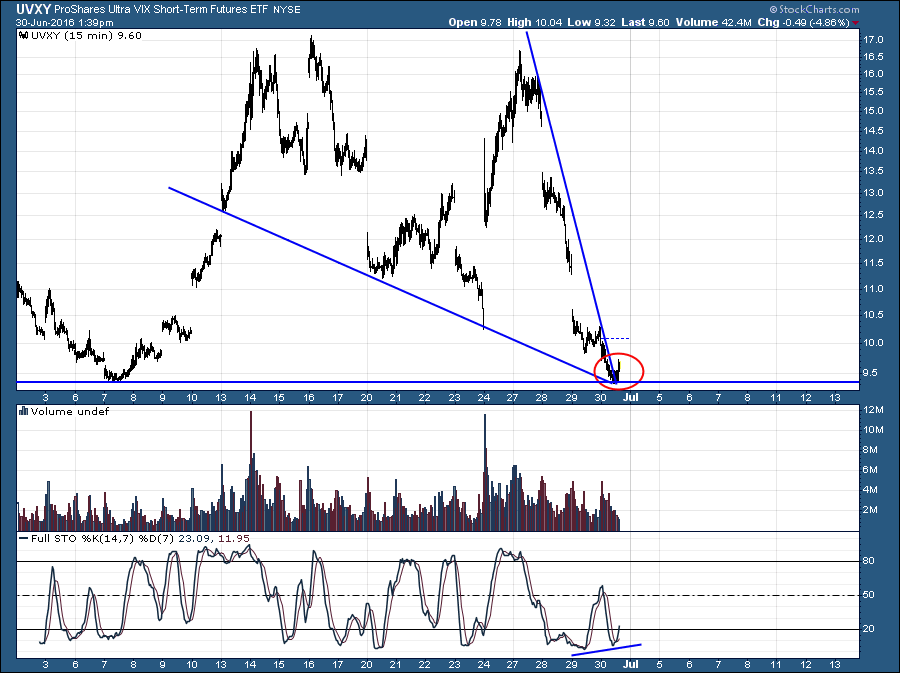
I like it long at this level. Simple to keep a tight stop. Perfect risk/reward long.
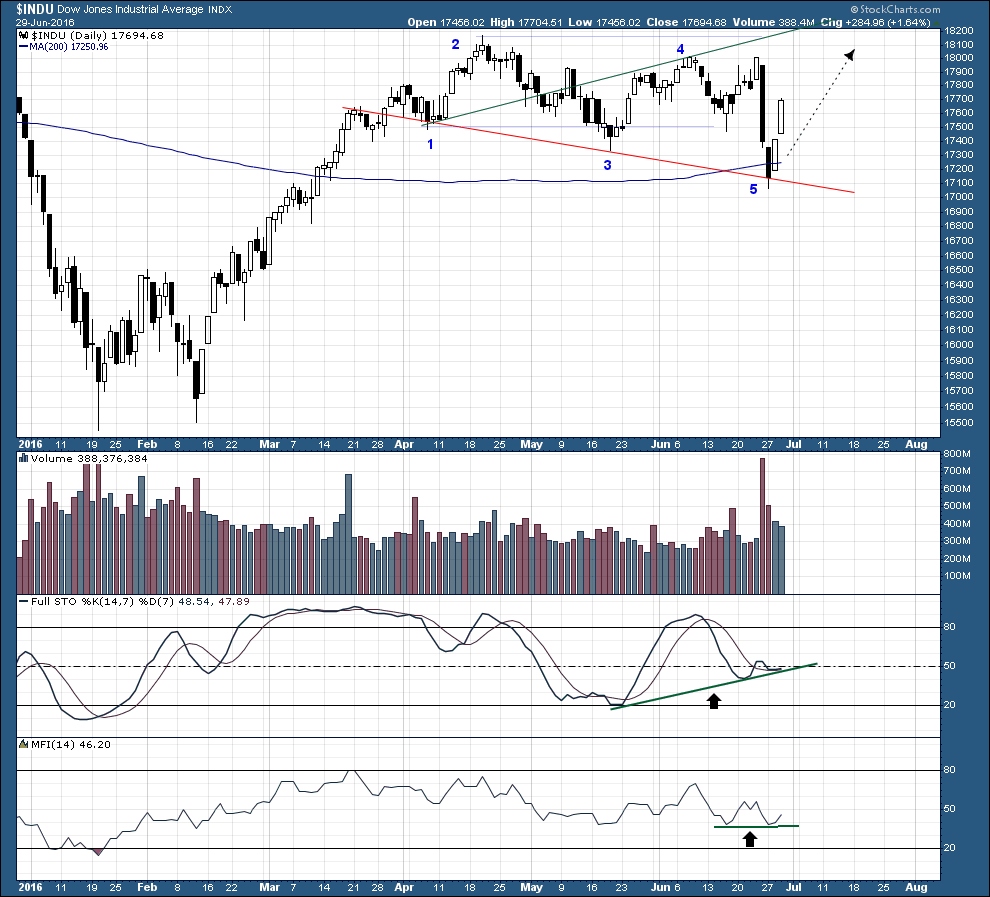
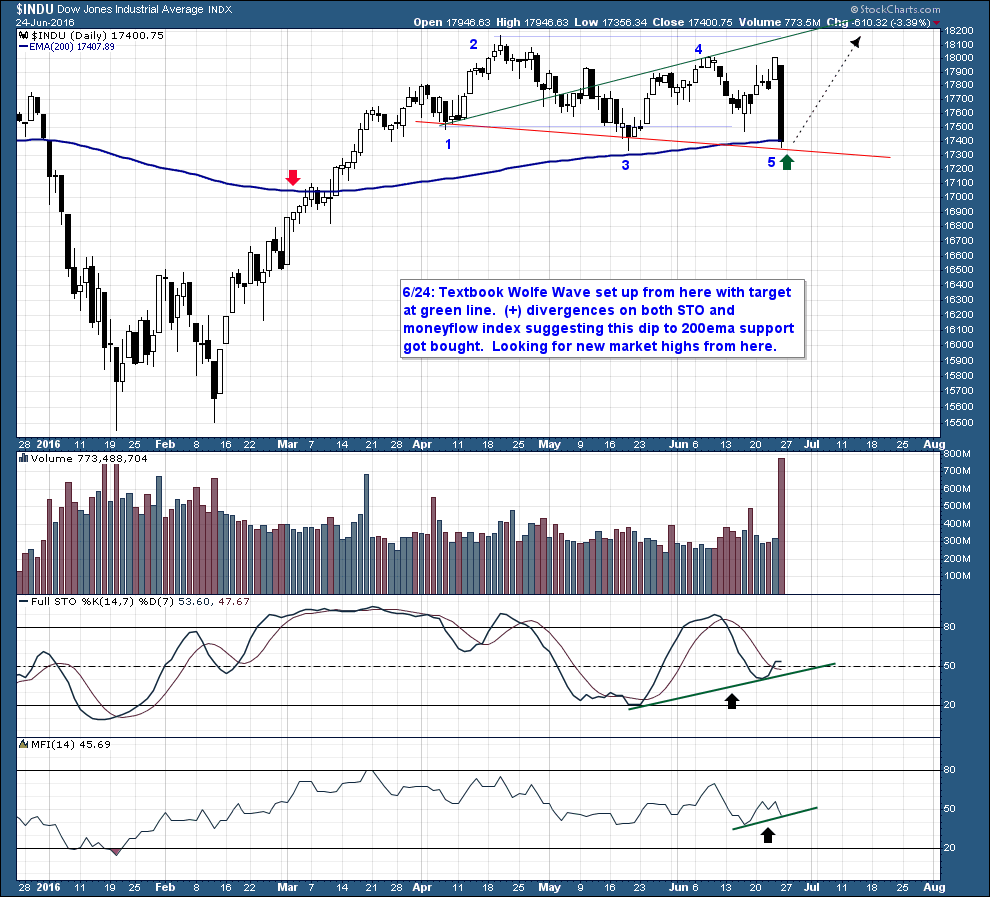
Fully was correct….it needed one more down day to get points 1, 3, and 5 aligned. Looking for higher highs……….
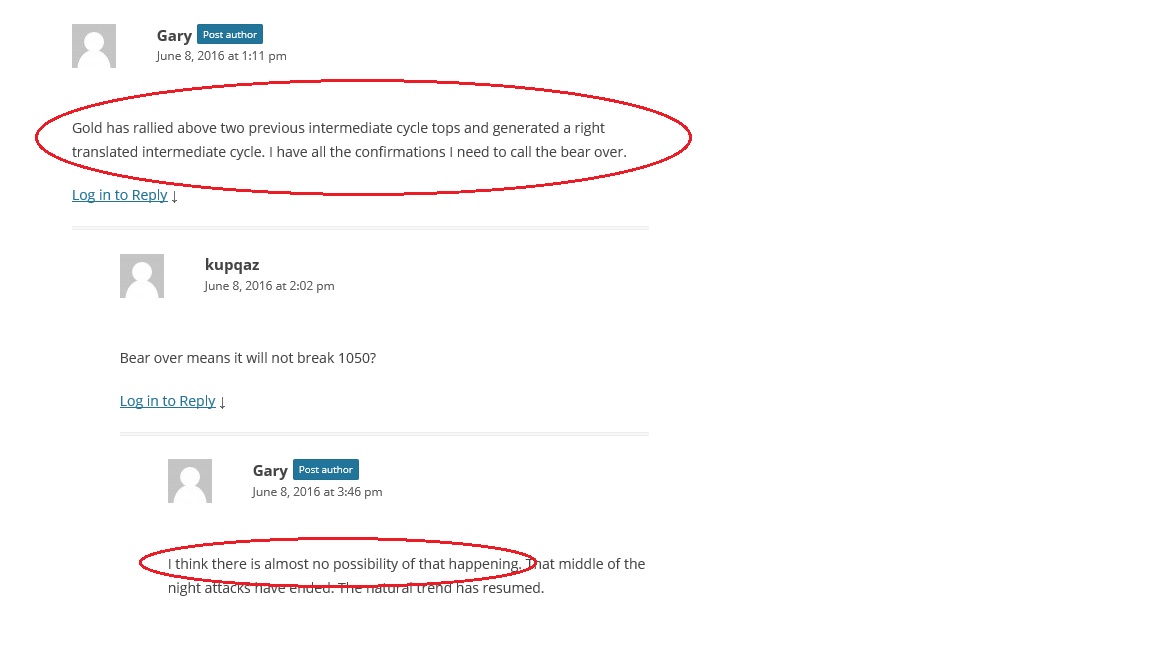
Mr Savage is uber long the metals here and is talking about silver breaking through major resistance. I think Savage and Gartman are neck and neck for the best contrary indicators. It was only a month ago that Savage was laughing at everyone who didn’t believe him that the next cycle low in metals was due by late June or early July. Isnt funny how he no longer even talks about prices having moved too far from the 200MA? But if prices ever do move back to the 200MA, he will be the first to remind everyone that he told you so….at some point….ummm, like back in March….or something. Yep, get rich quick…do the opposite of him.
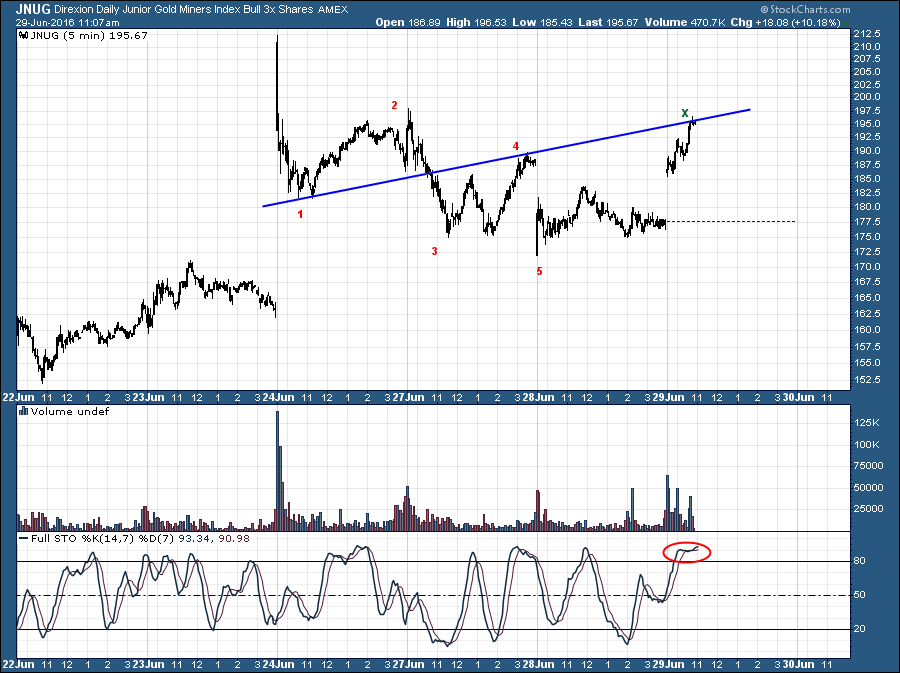
Added to JDST again at 9.01 on JNUG chart Point X.
Update: Added as low as 8.85…will post updated GDXJ chart…I keep selling the same resistance line…this will break down eventually…treading water at moment.
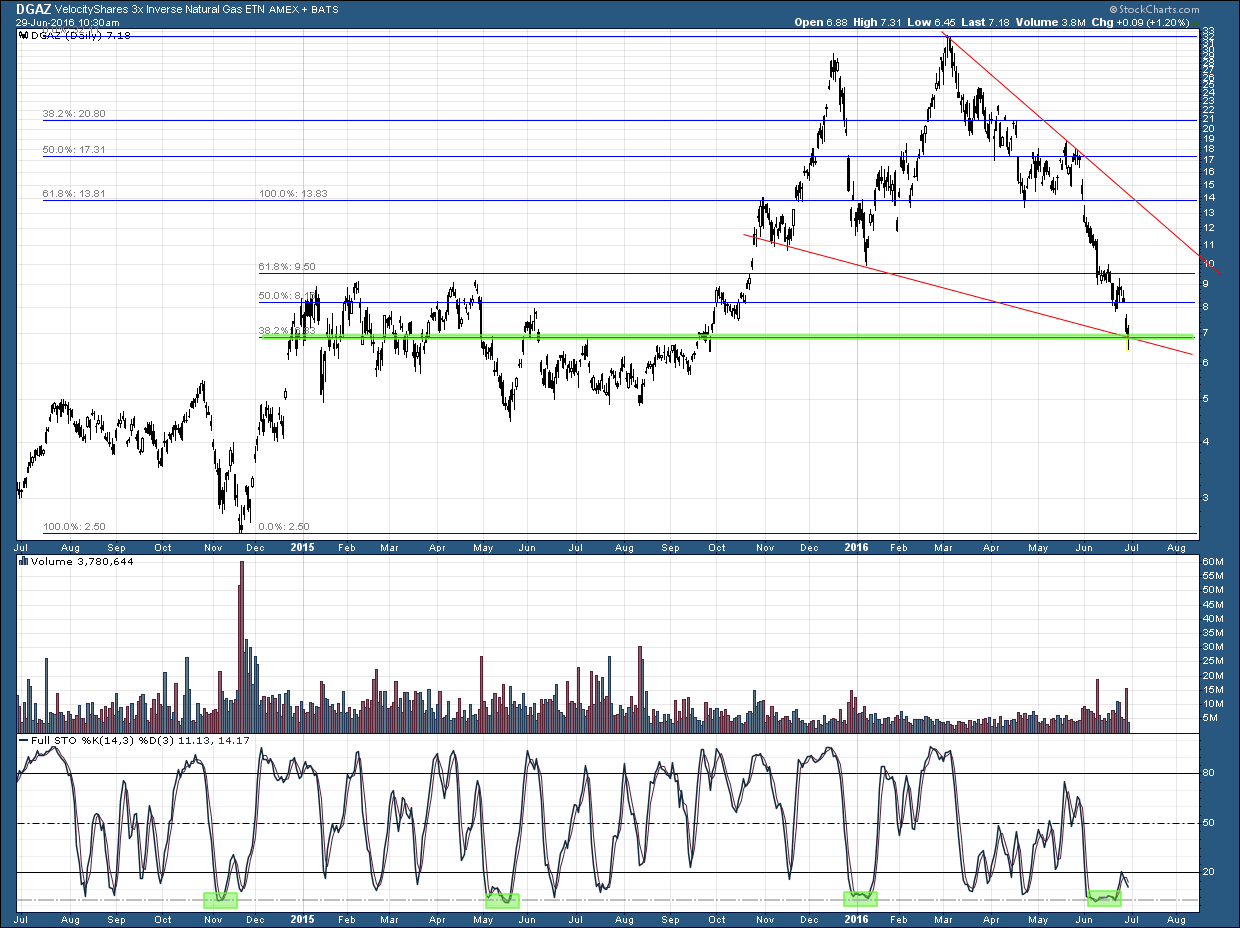
Holding lower fib level…added a little more but my stop is clearly defined.
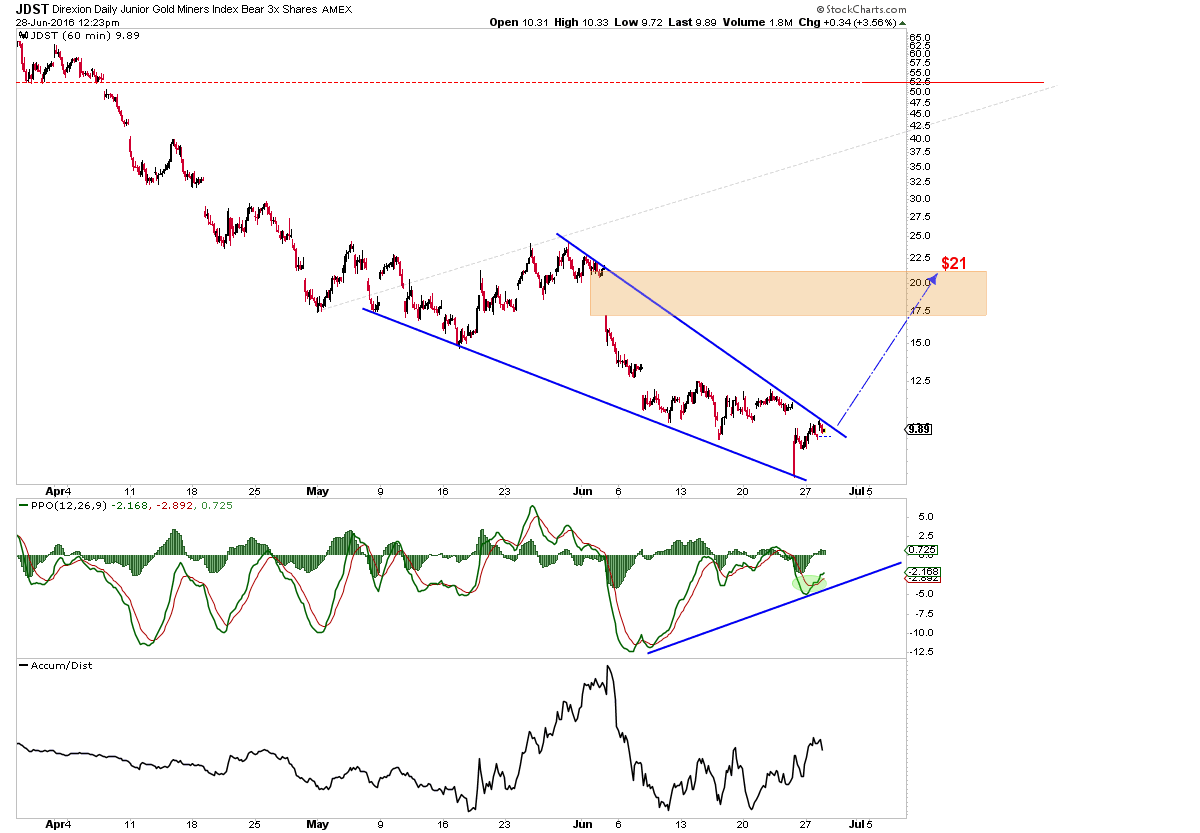
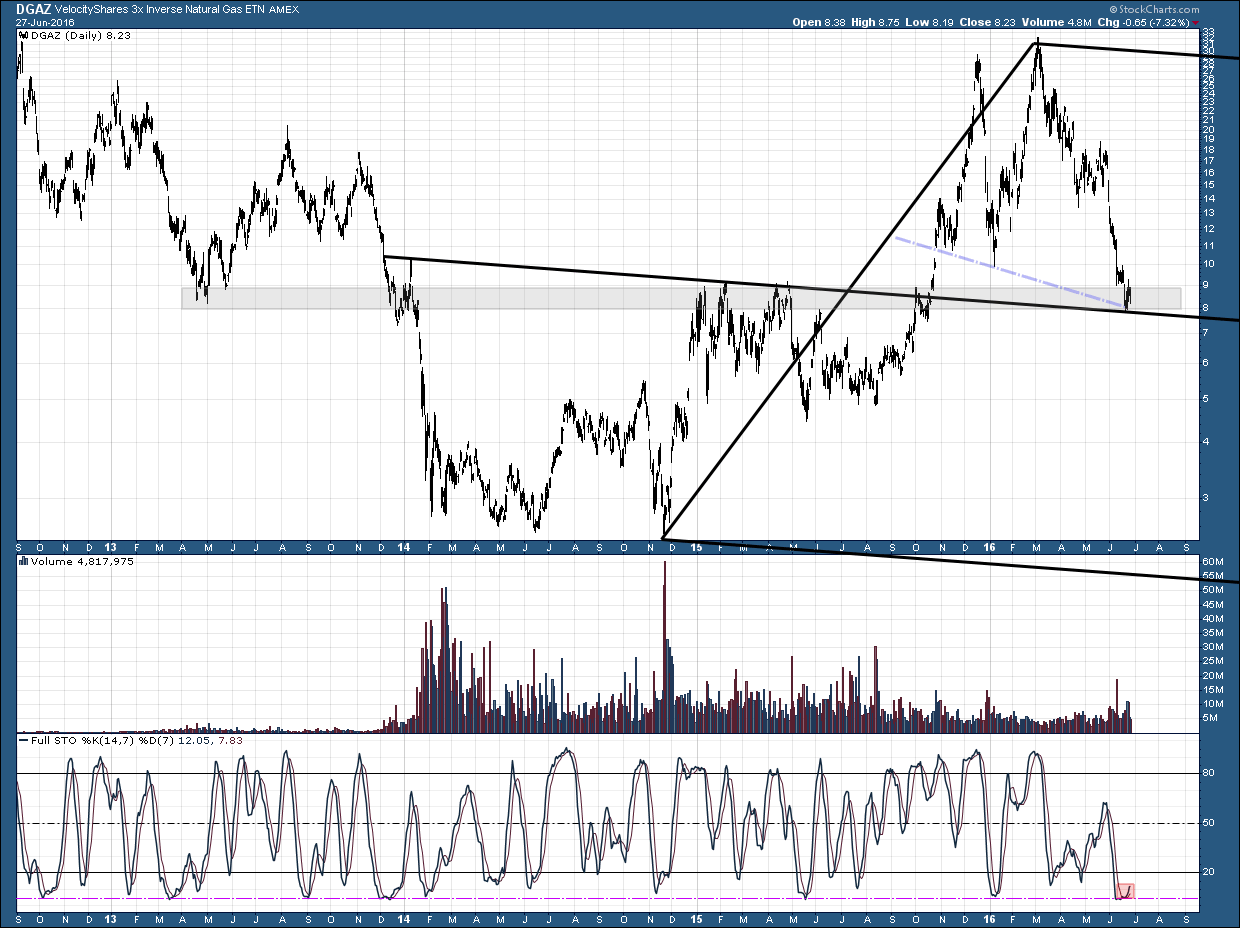
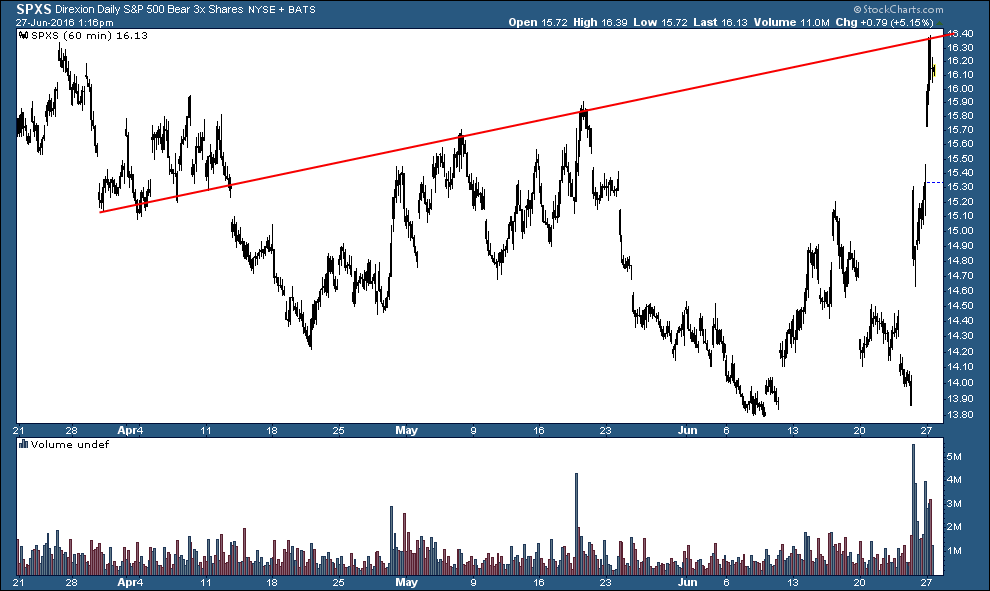
Looks close to breaking out of descending wedge with healthy internal (bullish flags) structure and mega divergences on oscillator as well as A/D line. Looking for $21 on a break out.
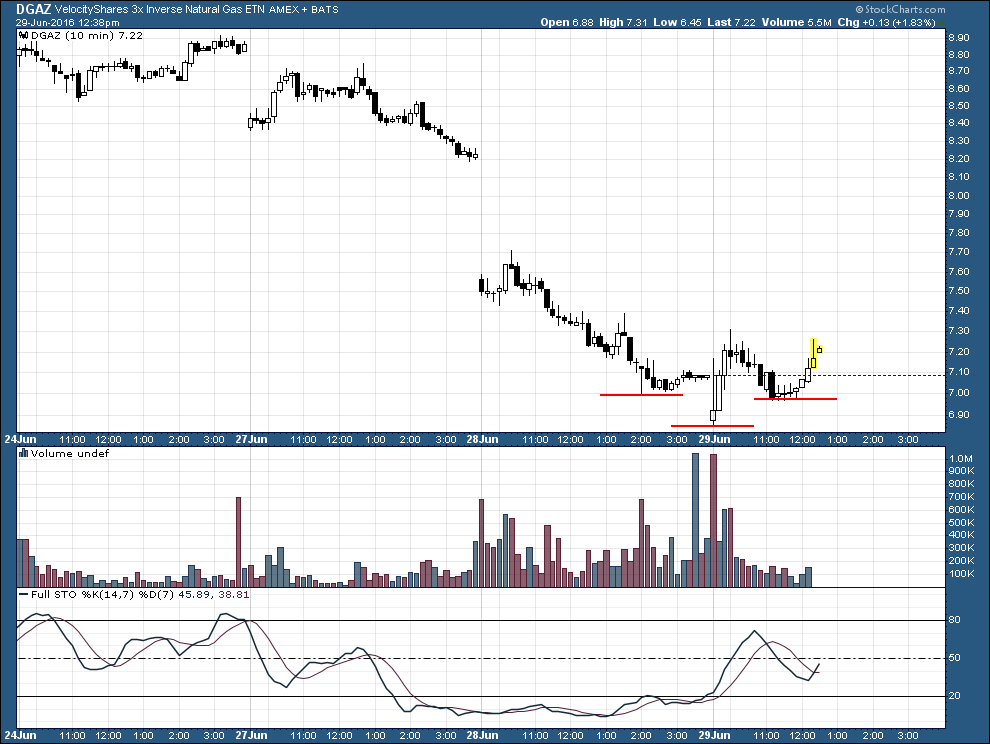
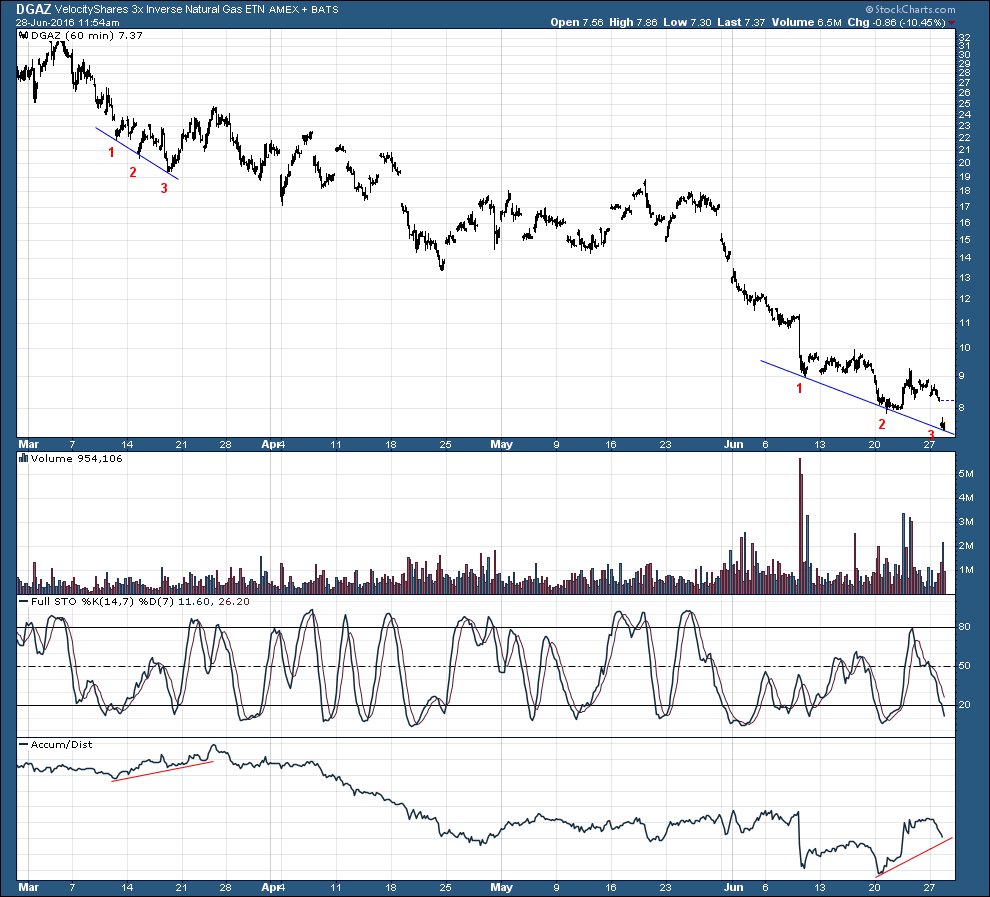
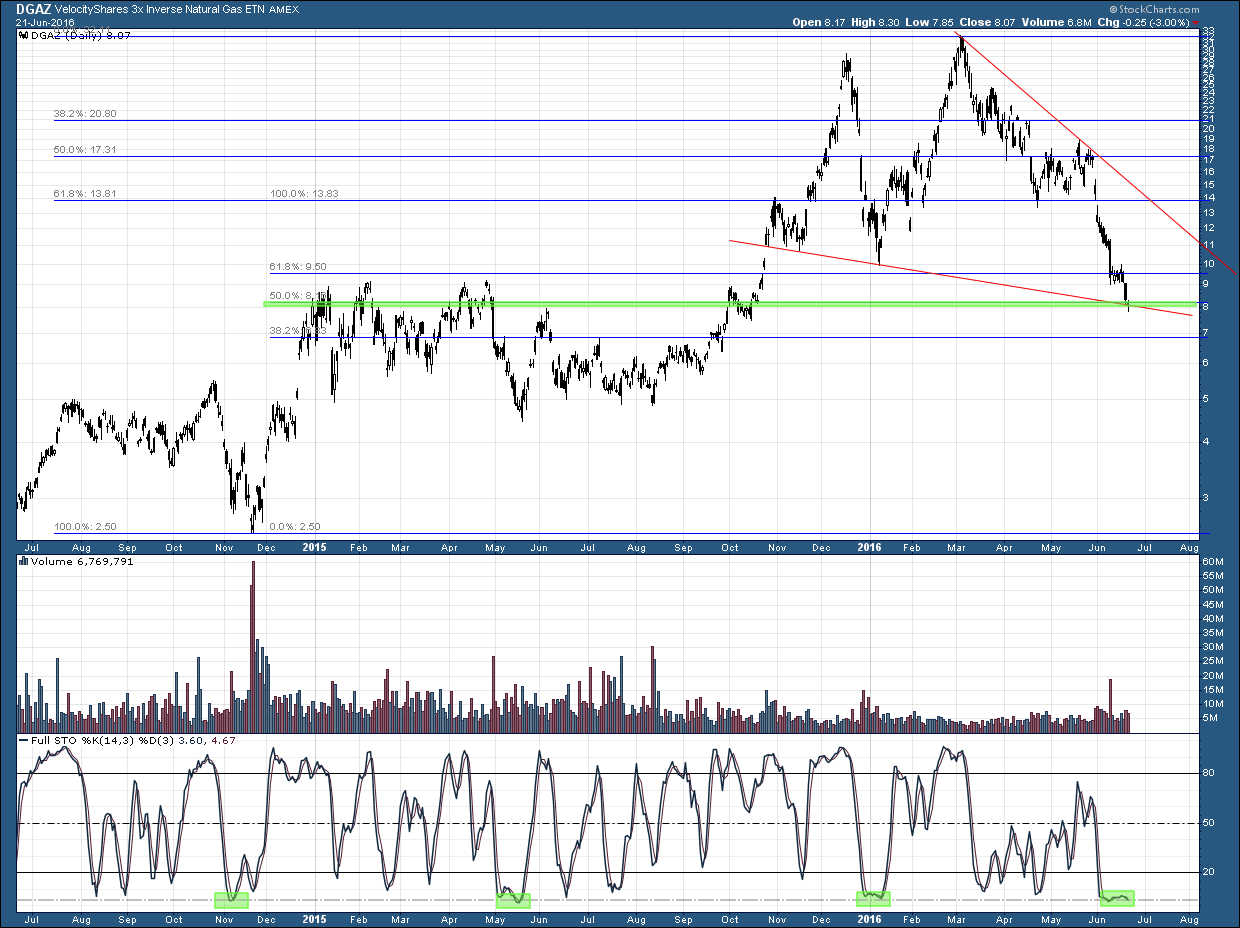
Well I’m not going to try to sugar coat this one…it most certainly moved against me today. However, I’m staying in the trade for now because I still like the structure….3 drives in a broadening context with strongly diverging A/D. We’ve seen DGAZ do this many times before as in the example below. With this said, if this doesn’t bounce soon I’m taking my lumps and getting out.
Edit: shortstack – see chart below….agreed
Still one of my favorite positions and getting ready to launch. I will bet this set up against a H&S theory on current prices.
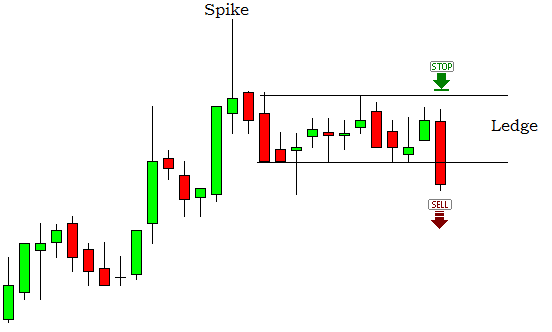
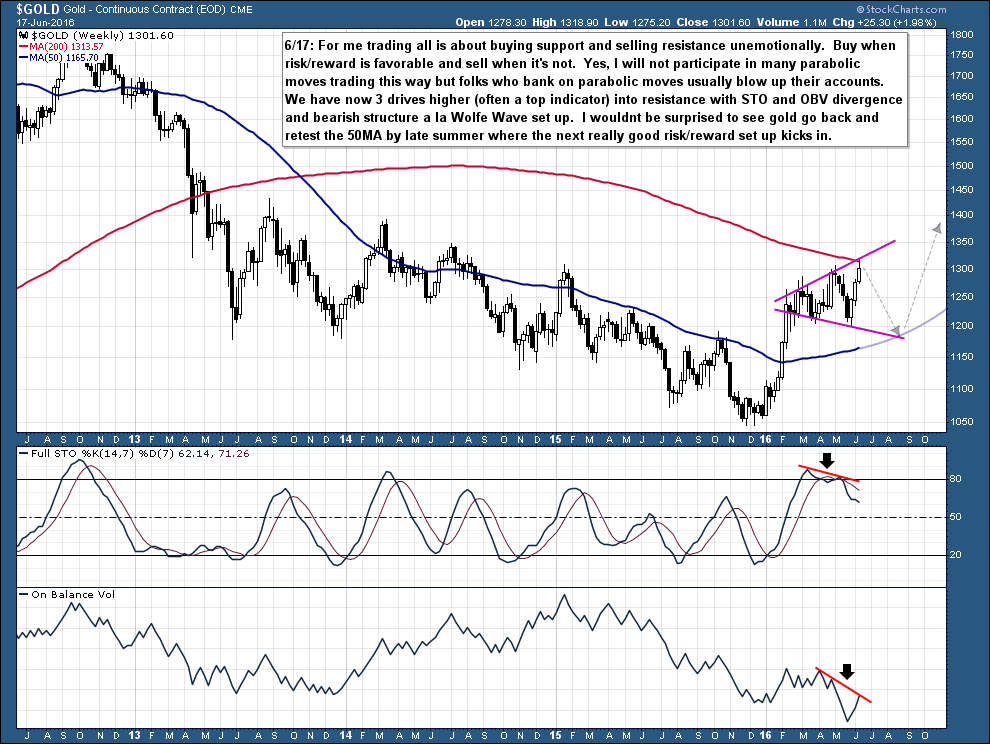
I’ve been watching this pattern materialize over the past 2 trading days. I don’t think it’s a pennant which would have broken last hour…I think the lower ledge is the trigger for a fall, if it occurs. Trigger is an hourly close below $1,315.
For those not familiar, here is an idealized scenario:
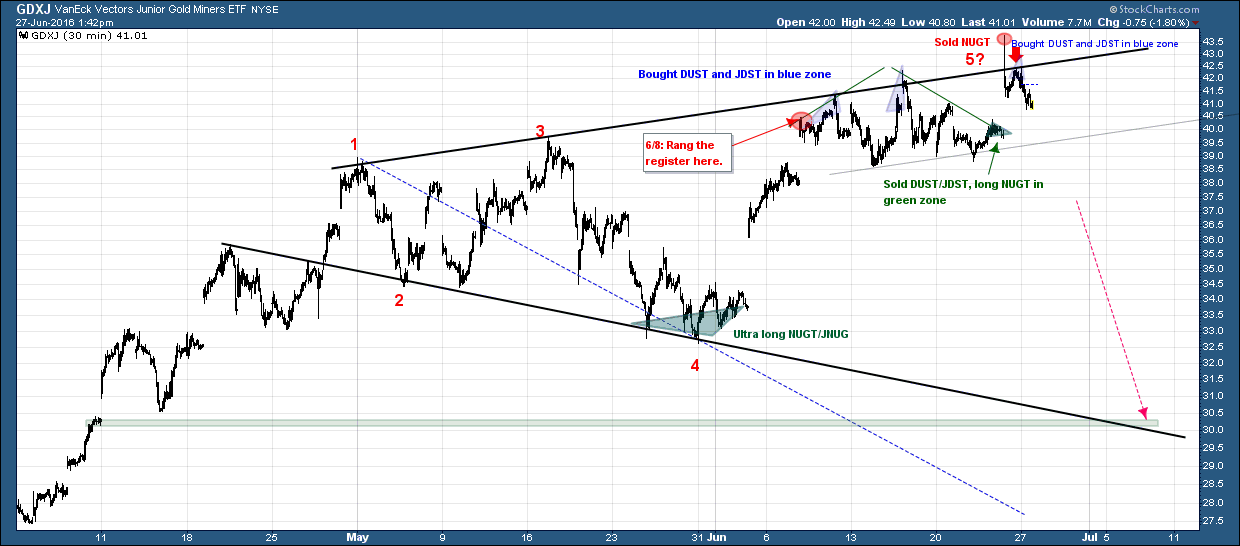
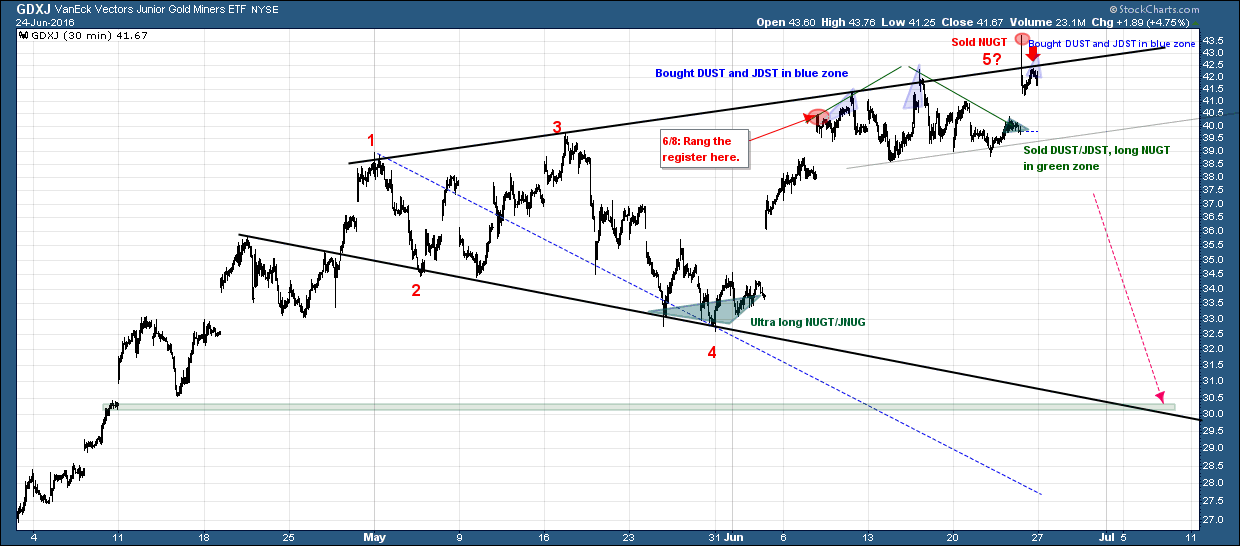
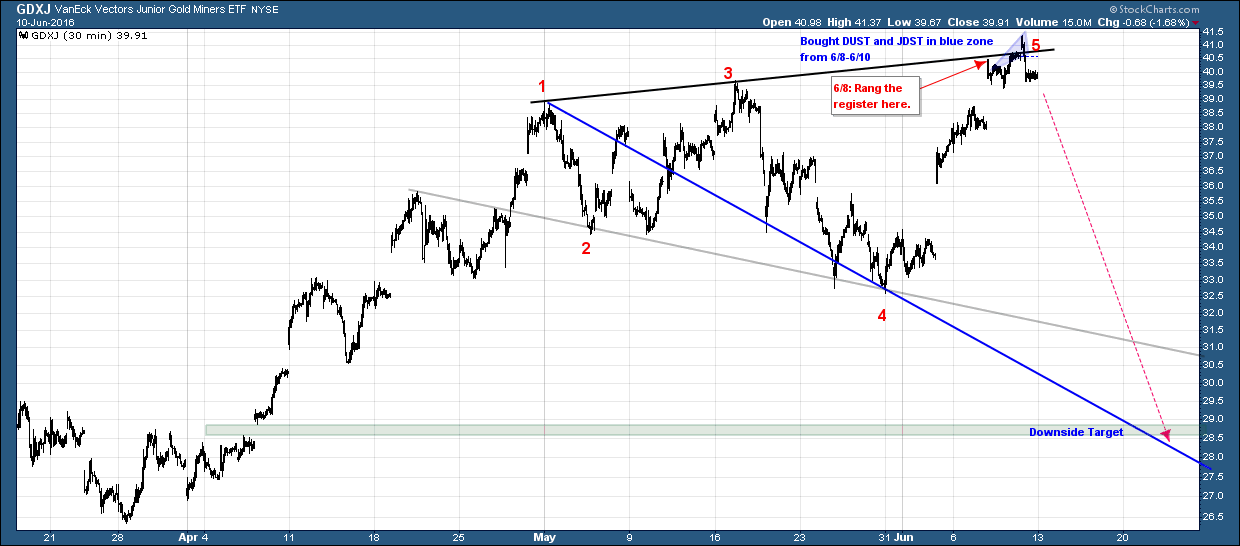
My trading plan today was to add more JDST on a GDXJ backtest to resistance at $42.50. We got one more bite at the apple as prices made it to $42.49. Average JDST cost is now $9.04 and I may be holding this one for several weeks.
S&P shorts be careful!
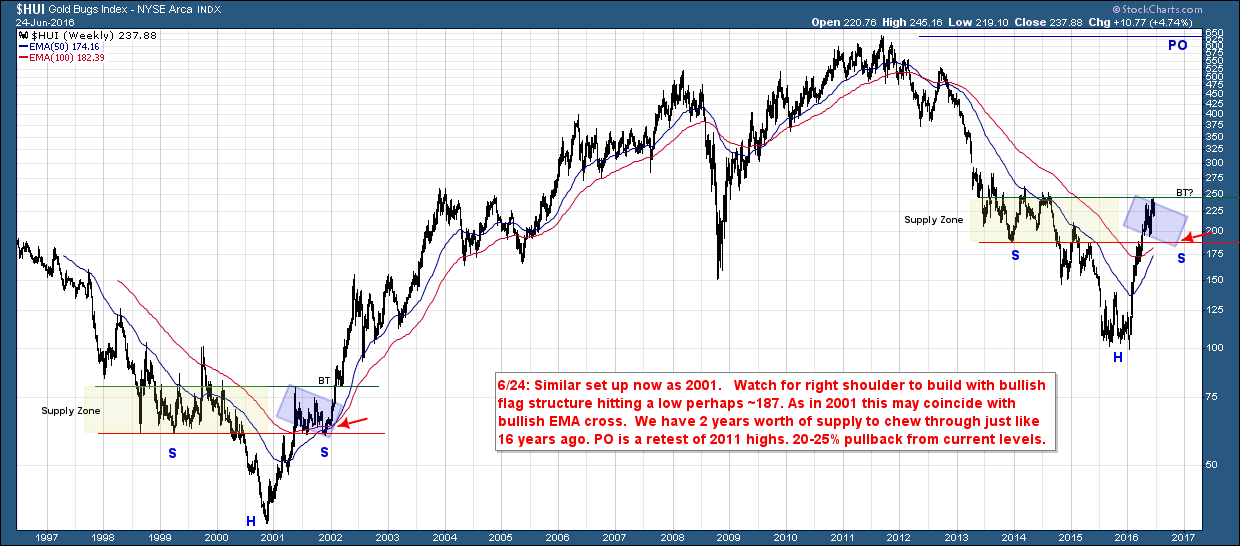
It’s still a really bullish picture but we may be in flag-building mode as we form a right shoulder, backtest EMAs, and chew through supply. The rest of the year could be frustrating to many PM/miner traders until perhaps after the Nov elections. The timing sure makes sense too. Again, I know this view is unpopular but to me it’s rational and unemotional. I refuse to take a 20-25% drawdown from here as prices are clearly at resistance and the odds favor some consolidation period from here. I’m braced for usual (but healthy) criticism 😉
The charts suggest Friday’s selloff got bought. A classic setup leading to new highs for the Dow on deck now. As you can see, no one-dimensional analysis going on here.
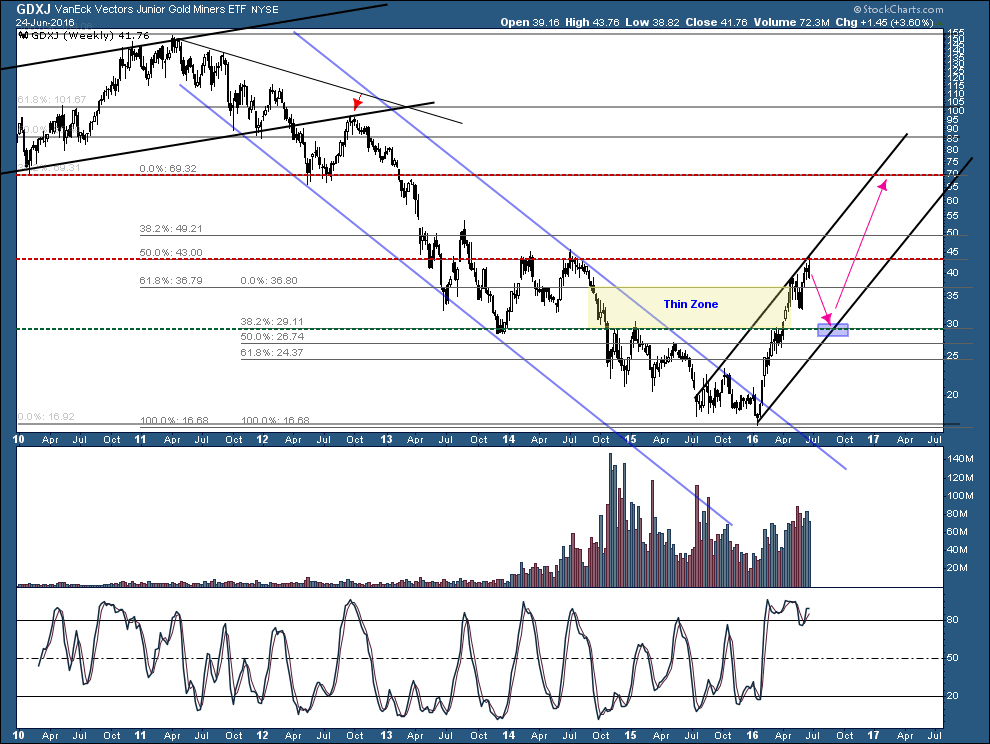
I think the essence of that chart from months ago is still in play and upside targets are as well. I’ve simply ratcheted back the initial resistance for a corrective move by one fib level down and here’s why:
1. $43 fib level matches multi-year resistance;
2. Prices are at channel top resistance;
3. Bearish wedge into multiple resistance levels;
4. Clear signs of selling into current levels based on A/D levels;
5. Thin zone below where prices historically have shot up and down quickly. These zones often act similar to gaps and often get refilled.
6. Negative divergence on many indicators.
Again, I’m not denying we are in an uptrend but I feel current levels are quite vulnerable to a healthy correction due to mainly a confluence of resistance and I’m sticking to my system of selling resistance.
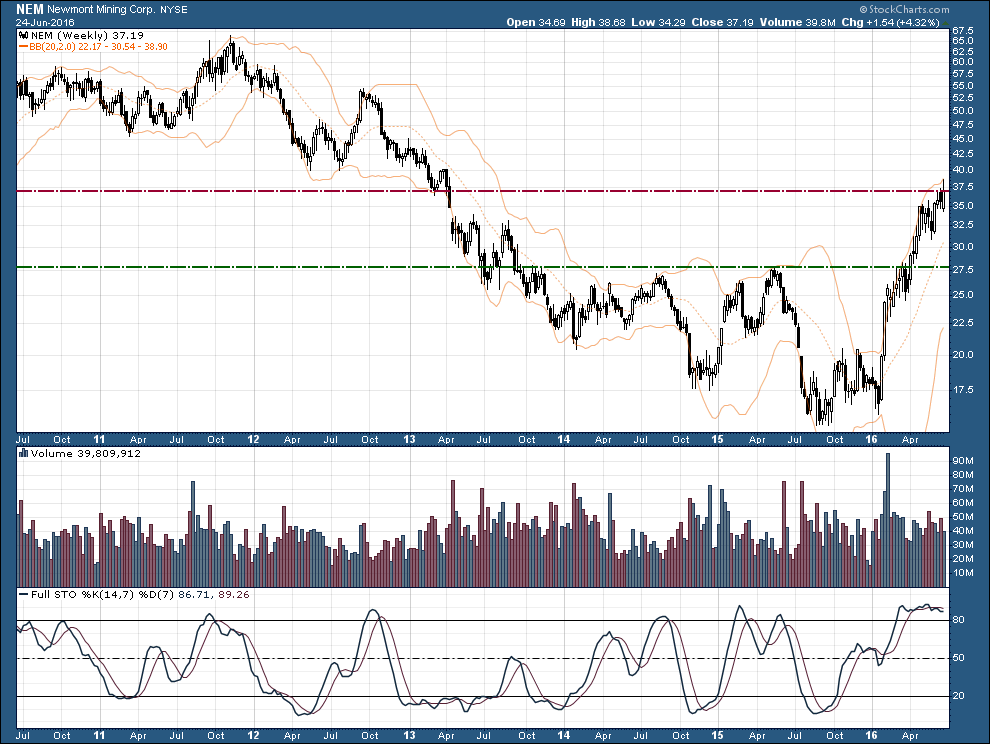
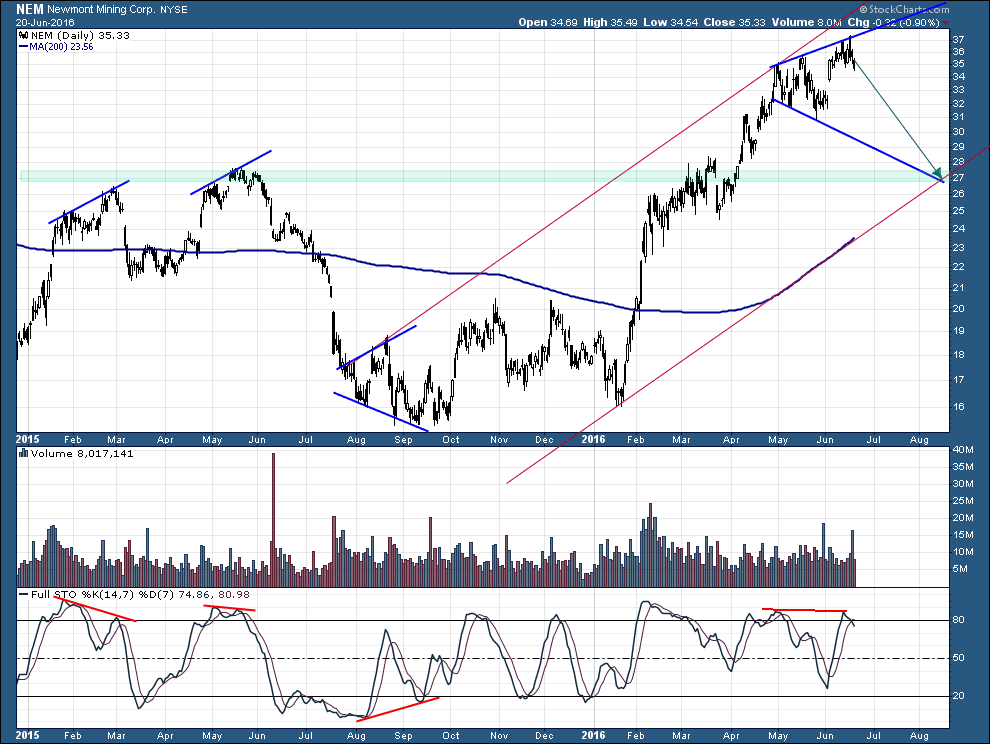
I’ve had the red and green lateral support and resistance lines drawn on this chart for months. I’m still looking for a retest to the $27.50 breakout which should launch NEM for years to come.
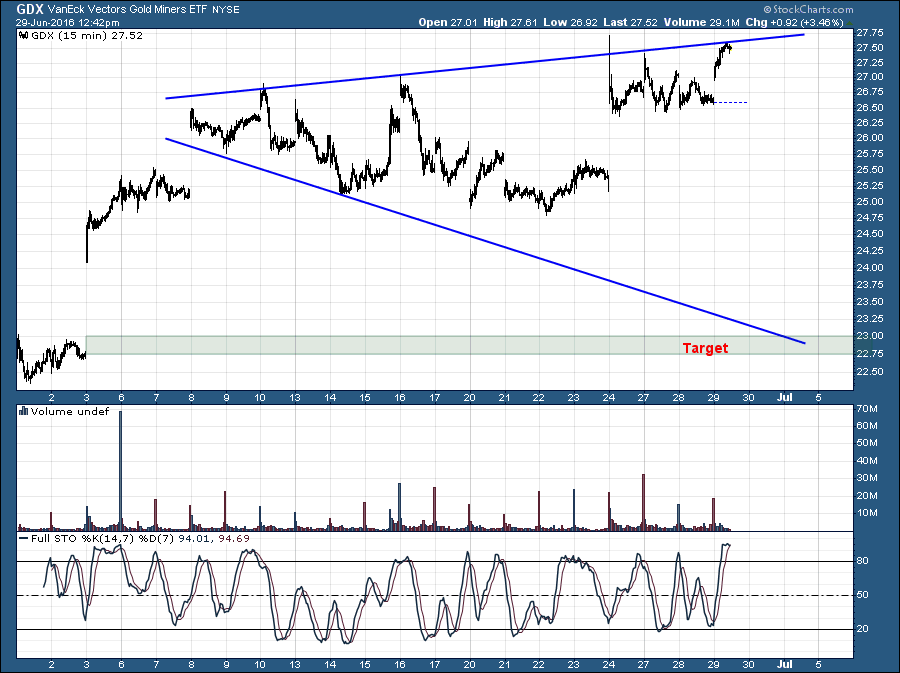
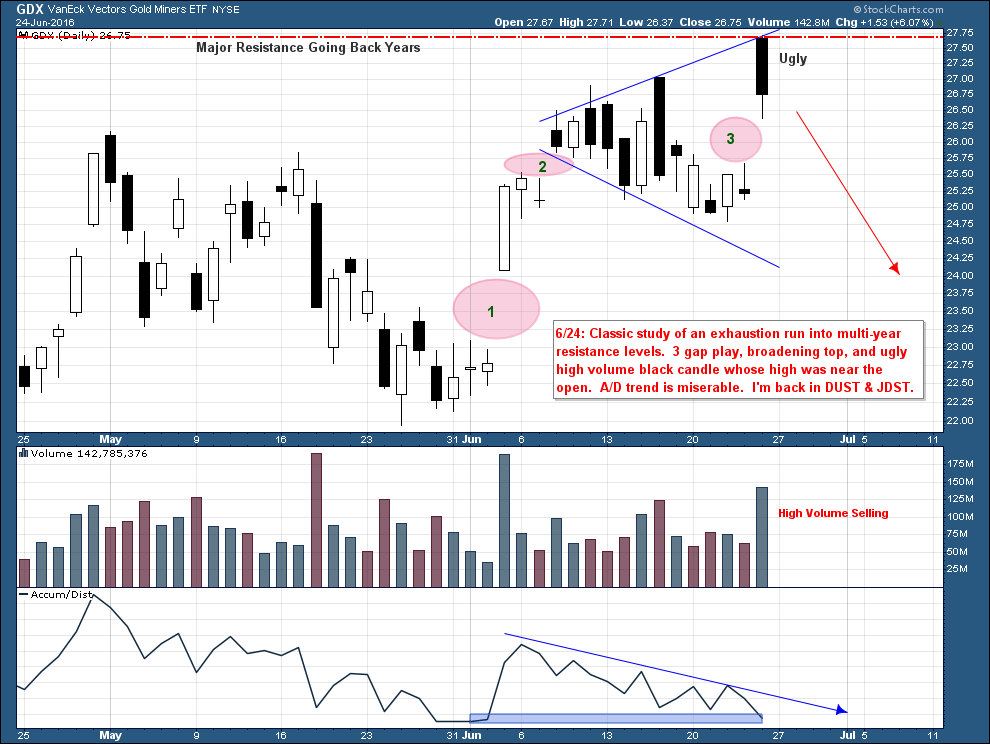
I sold my NUGT in the opening minutes today and then waited for intraday structure to develop before taking fresh DUST/JDST positions at 2pm when the miners backtested a major resistance line. Buy support….sell resistance…it never gets old. I’m posting what appears to be a textbook exhaustion sequence in the GDX. If the GDX couldn’t close above major multi-year resistance today, it clearly is going to need some time to build cause with lower prices coming first.
People are calling today’s action a breakout and all the talking heads are advocating owning gold here….well gold looks way better than the miners. Again, I’m certain my views are in the minority 😉
The following GDXJ chart illustrates how I’ve been swing trading both directions over the past month. By always scaling into my positions (for best average position cost) and always buying support and selling resistance, I minimize risk and don’t have to get the timing of the trade exactly right…which I clearly am not. Nonetheless all my trades over the past month have been profitable and better yet, significantly more profitable than if I had just sat on my positions. There’s nothing wrong with buy & hold and swing trading clearly isn’t for everyone, but I’m trying to make a point that it can be rewarding while containing risk.
Note the spike & ledge looking intraday pattern today. A break below today’s GDX(J) lows could start a cascade of selling.
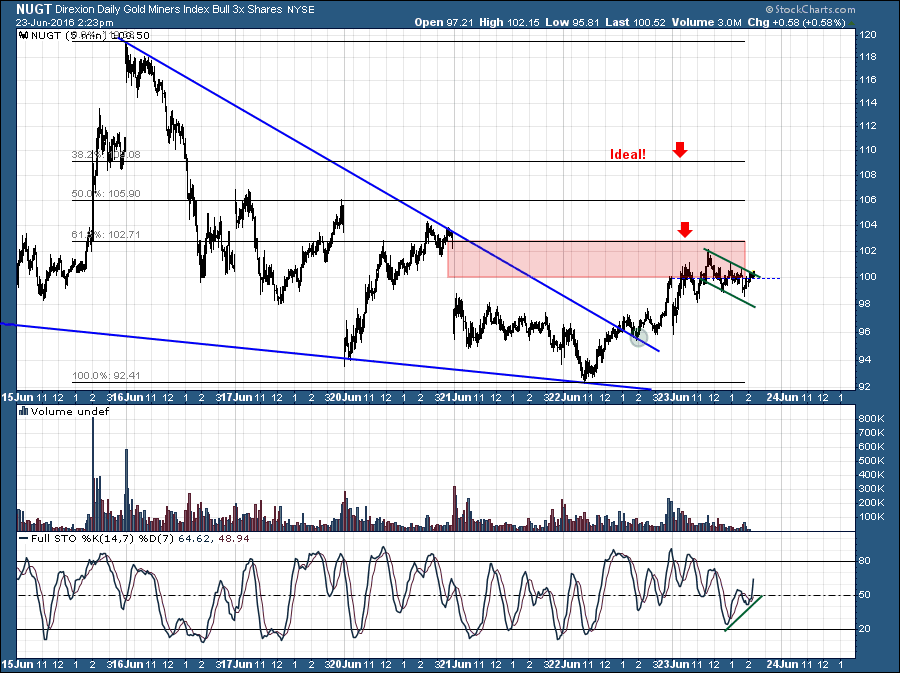
Here’s the 5-min chart I posted late yesterday. I took a small NUGT position early this morning (already nicely in the green) as it does look set up to reach one of my fib targets, however I don’t think this is a place to make large bets either direction. Ideally I’m looking to make a little money on this bounce before closing NUGT and migrating back into DUST. I’m using the weekly charts to guide me on where the risk/reward is best right now and I think it’s getting into a good risk/reward level for establishing new DUST positions. Again, I ideally would like to see GDX run up to $26.20 before reversing in a corrective move for the most of the summer.
My charts are suggesting tomorrow could be a strong bounce day for the GDX ahead of the vote and I’m quicker these days to book profits when I have them. Depending on how things settle out tomorrow I may take some fresh PM positions, or more likely remain flat on PMs going into Friday morning.
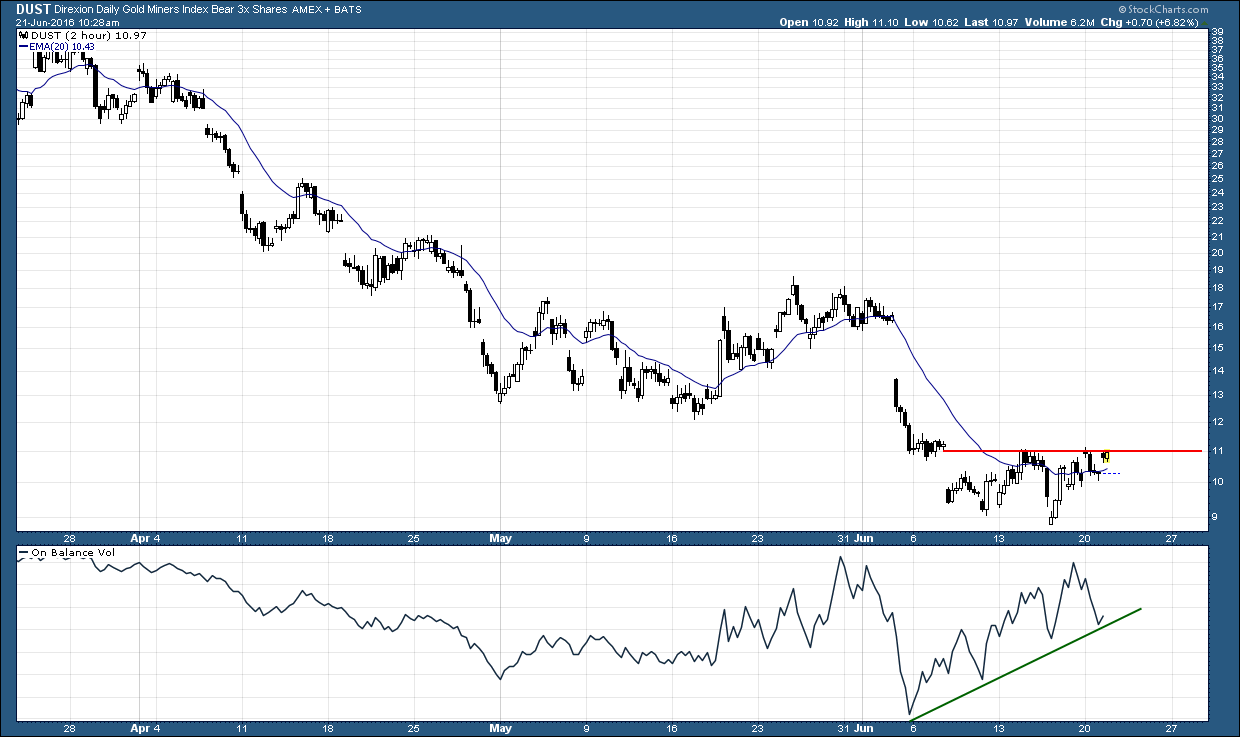
Again, always playing the solid risk/reward plays by buying support and selling resistance and pulling the plug quickly if wrong. I’ve built a pretty decent long position at current levels. Ideally looking for a pop to ~$14 swing trade.
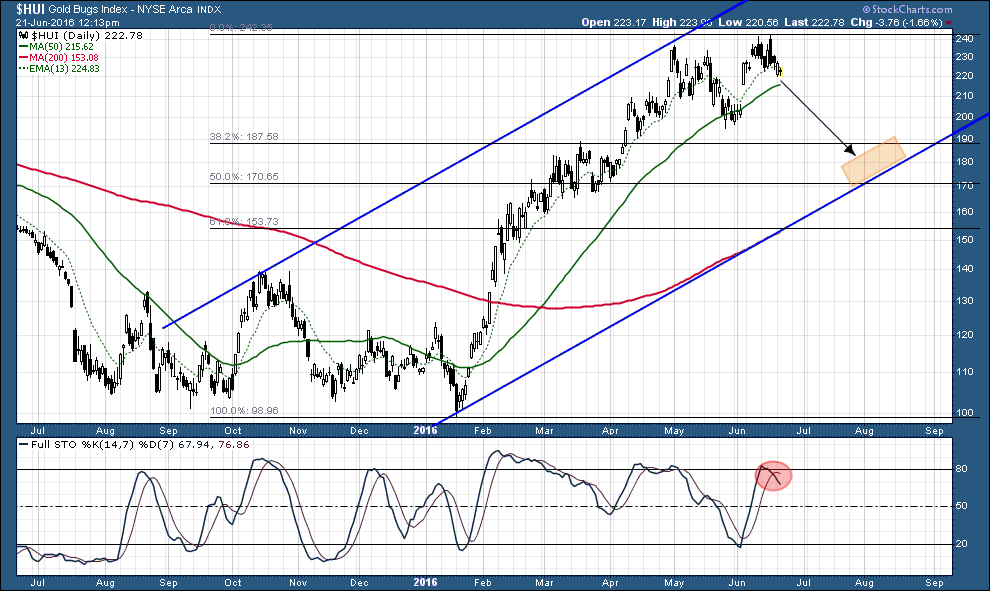
I feel it’s no different than the NEM example I provided. I truly expected a better first bounce off the 50MA. I loaded the boat for that bounce and made a ton of money but clearly momentum is waning. Once the 50MA fails, I think we head towards my orange box target area. I will be looking for structure consistent with a healthy correction to unwind my short positions and reload on the longs. Obviously my take on the markets is updated in real time so by next week things may look different but this is how I see things today.
Yes, not a popular view here I know but I have zero bias….zero…I don’t care about sitting tight or what world economics and politics suggest or what some cycle interpretation tells us, these are just charts to me and I trade them the same regardless of what the underlying equity name is. Let’s be honest, if this were a chart of the S&P or RUT, 99% of you guys would likely interpret this the same way I am….but it’s a PM therefore only the most bullish outcomes are the most likely in most people’s minds.
NEM is setting up classically to correctly back to a confluence of broadening wedge support, channel support, key S/R level support, and 200MA support….all converging at $27. That’s a 22% pullback….if that’s within your risk tolerance for a “possible” multi-year bull market taking form then just sit tight and sweat it out….I suspect many will end up selling at exactly the wrong time because the pain becomes too great.
As indicated over the past couple of weeks, I’m growing less incentivized to share all my charts but I do feel that I need to add this view to restore a little objective balance to the board. It’s just low odds in my view for gold and the miners to power through the kind of resistance and divergences I’m seeing right now, hence my near-term (~2 month) bearish stance. If there is one thing that consistently doesn’t fail me in trading in terms of aligning odds in my favor that is to buy support and sell resistance and then act immediately if your premise is wrong! You will provide yourself with an excellent risk/reward entry while being able to keep a really tight stop because you know right away if you’re wrong.
Here is a chart for your consideration.
As mentioned on a comment to Graddhy’s recent post, I really don’t like how many charts are shaping up right now and I’m trying to be as objective as possible. For now I’m full-on bearish and positioned accordingly. I’m not going to show all my supporting charts but I am providing a version of my GDXJ chart posted the other day. It wouldn’t surprise me at all to retrace all of the miner gains since the March consolidation from here. Ironically this would make Savage right but at the wrong time…..ha….he’s completely in the bullish camp now at what I believe is EXACTLY the wrong time. Yet, another piece of outstanding evidence.
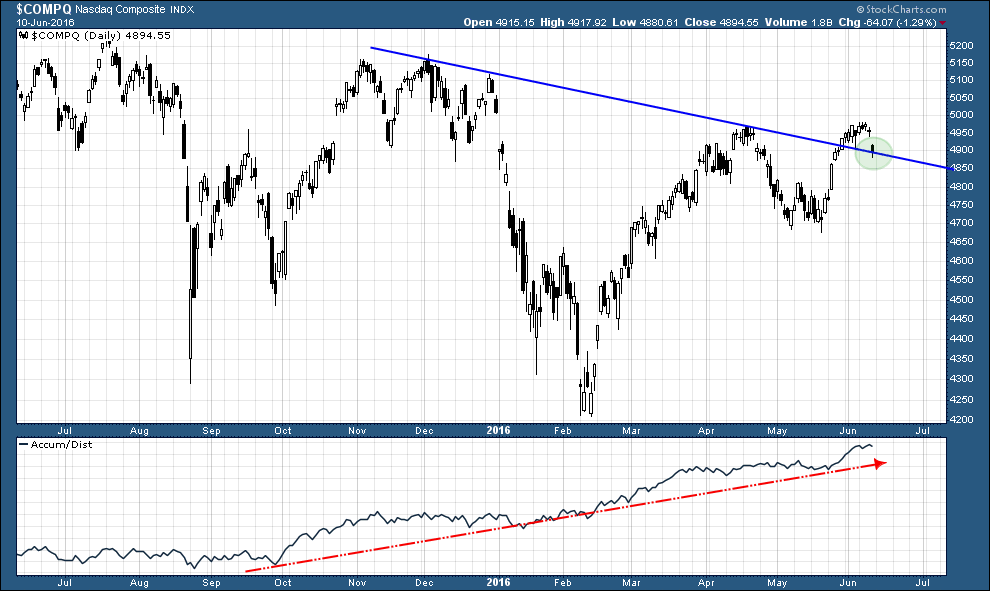
Naz looks to be backtesting breakout. May get a bounce Monday. Post chart later.
Here’s the chart prompting me to bag a nice profit. We will likely get another bite at this one too but I hate giving back chunky profits along the way.
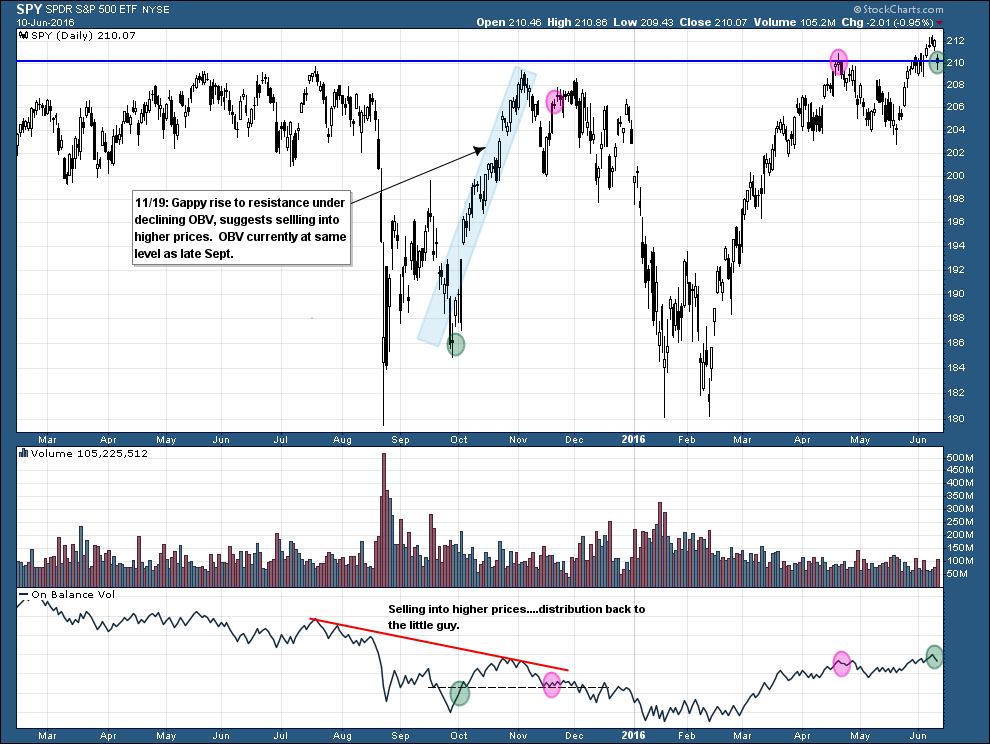
Old SPY chart of mine showing my analysis ahead of plunging countermove last year and my basis for the call. You can see the internals are much more healthy this time. You guys who are being aggressively short the SM need to be careful! Pick your spots wisely like the gift we got in the IBB/LABD trade.
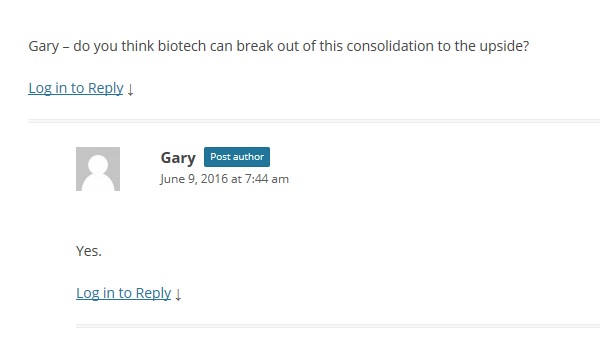
Another classic lesson in buy support and sell resistance. Almost a layup climbing into LABD as prices tagged downtrend channel and fib resistance. IBB has already given up nearly all gains in the past 2 weeks in just a couple of days. Plus Mr. Savage was telling his subscribers that biotech would very likely break resistance….ha….poor odds Gary….he should give up cycles and try TA 😉
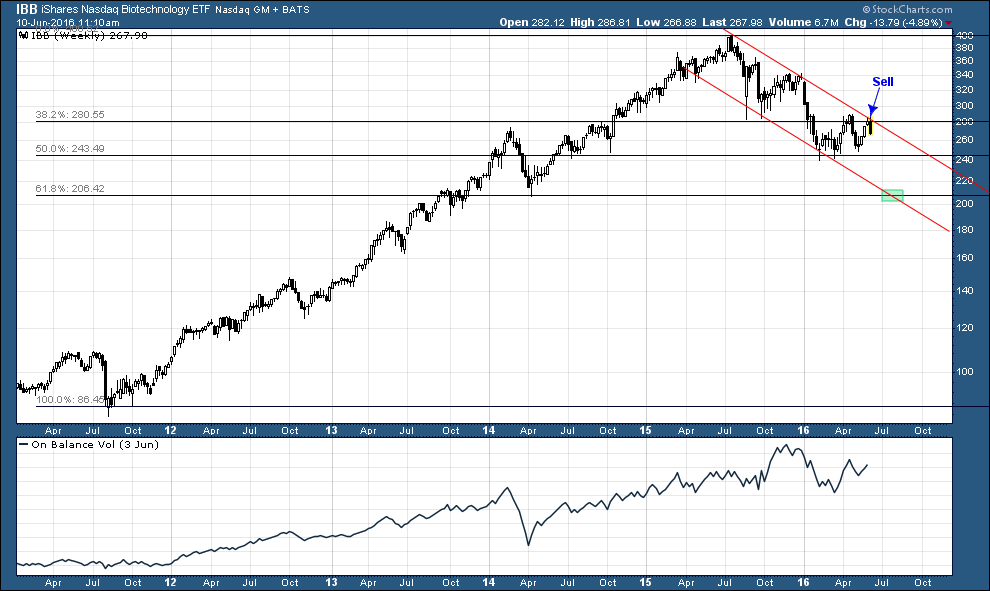
Here’s an example of reckless advice given to subscribers yesterday on this sector. It is unconscionable to recommend buying into multiple resistance levels in a downtrend. Either sell/short there or stay in cash until the breakout is proven.
Again, looking at a swing duration but all my charts suggest a correction is imminent here in the miners.