HUI Monthly
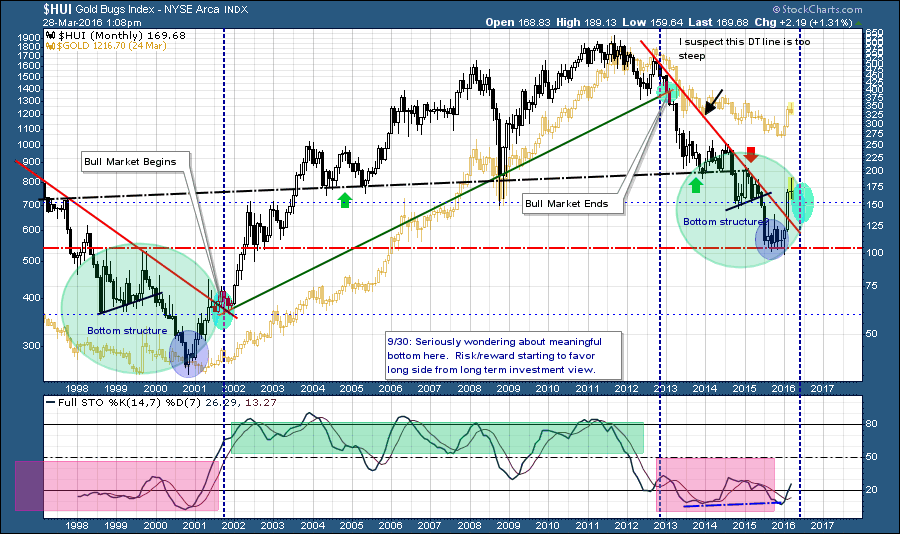
Hey everyone…hope all are well here. I’ve been in buy-and-hold mode (PMs and energy) since Dec 2015 and it seems to be serving me fine as I focus on other things these days. I suspect I wont be selling anything this year as I have a multi-year investing horizon but I do like to occasionally refer to my charts to confirm that my premise remains intact. I thought the group may find my HUI monthly chart interesting, untouched since 9/30/2015. I suspect the next few months will frustrate many swing traders as prices likely consolidate before the next leg up later this year. The interpretation of this chart won’t be validated in my view until the STO crosses 50 but it looks pretty clean so far.
Mark, Cheers! Great Fractal chart and update. Wish you had more time to post as your stuff is always awesome.
Agreed. Thanks for stopping by, Mark.
More fine work – thank you. BTW, this also illustrates why the stocks have so much catching up to do to the price of gold. 🙂
Thanks Mark
Hope all going well with you
Keep in touch
Fully
Thanks for the update…please share any important turns you notice…