Settle down out there knights and raring to go bulls
Amazing how a little short squeeze price action gets the juices flowing and gets one dreaming of the riches again. I just see this launch in the GDX and the market also as simply the mechanical action of the shorts getting into position to profit from a logical down draft and then someone yells fire in the theater and sparks a short squeeze. Once the squeeze is on the upside panic changes the psychology to that of the bottom is in then it feeds on itself to the upside. And now we witness a cottage industry develop overnight of bottom callers and the race is now back on!
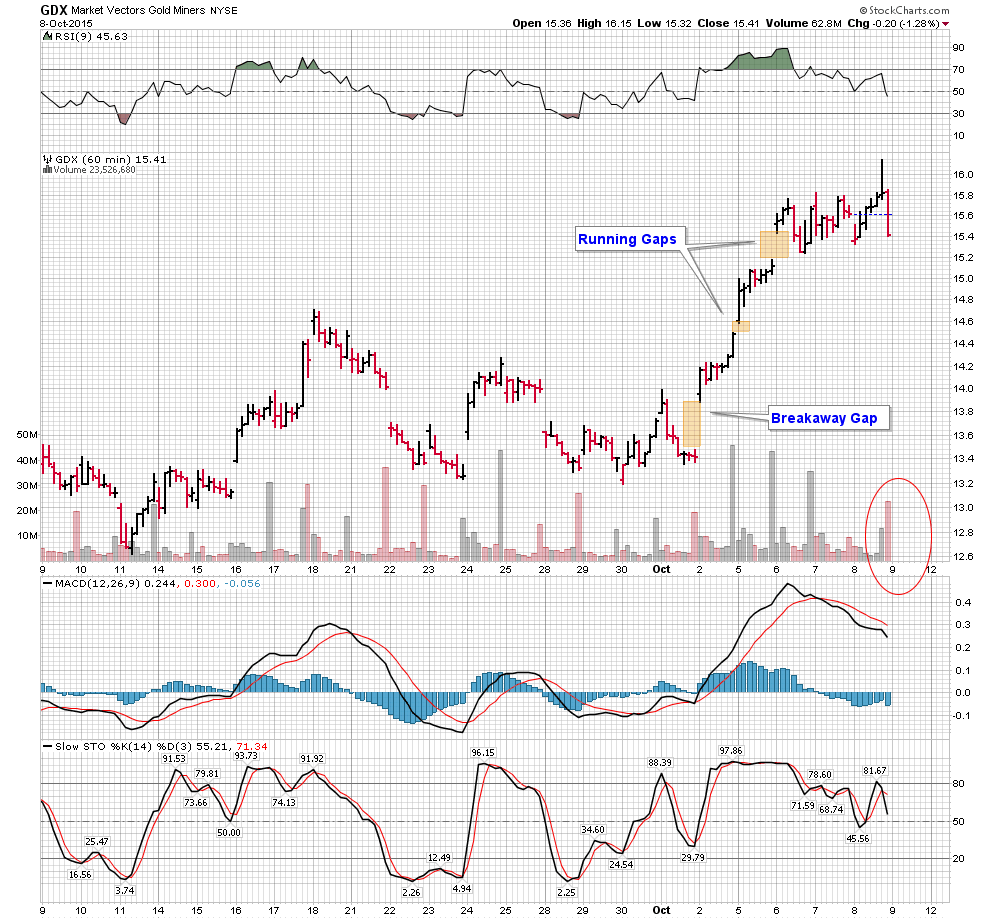
That’s not what I see in the price action however. Mark has well pointed out the gaps in the charts. Let’s talk about what they mean. I see the initial spark portrayed in the breakaway gap of October 2nd. 99% of gaps eventually get filled, however it is the breakaway variety which has the most chance of not being filled. So thats bullish, however where is the volume??? True bull market starting breakaways normally have massive volume dwarfing previous days trading volume and frankly, you can see, its just not there. Next we have a series of two runaway gaps. These gaps denote urgency. Urgency from short covering is the likely source. Runaway gaps almost certainly get filled in relatively short order. Also note the volume has tailed off on each successive thrust upward until now it has exhausted itself until todays downside reversal
Now lets discuss what it takes to really start a bottom. It needs a base And that base must form below the 30 W EMA. Normally we get a few thrusts above that 30 EMA and each gets slapped back down. They are made up of good soldiers doing their duty making the attack, but ultimately diving off for the greater cause. This is the process of eventually turning that 30 EMA up and then we can finally get a thrust above it. That “real deal” penetration will be on volume. 2-3X normal daily volume. Eventually we get a pullback and the all important test will be will it hold that 30 EMA. If it does and then starts an advance only then should we make claims that the bottom is in.
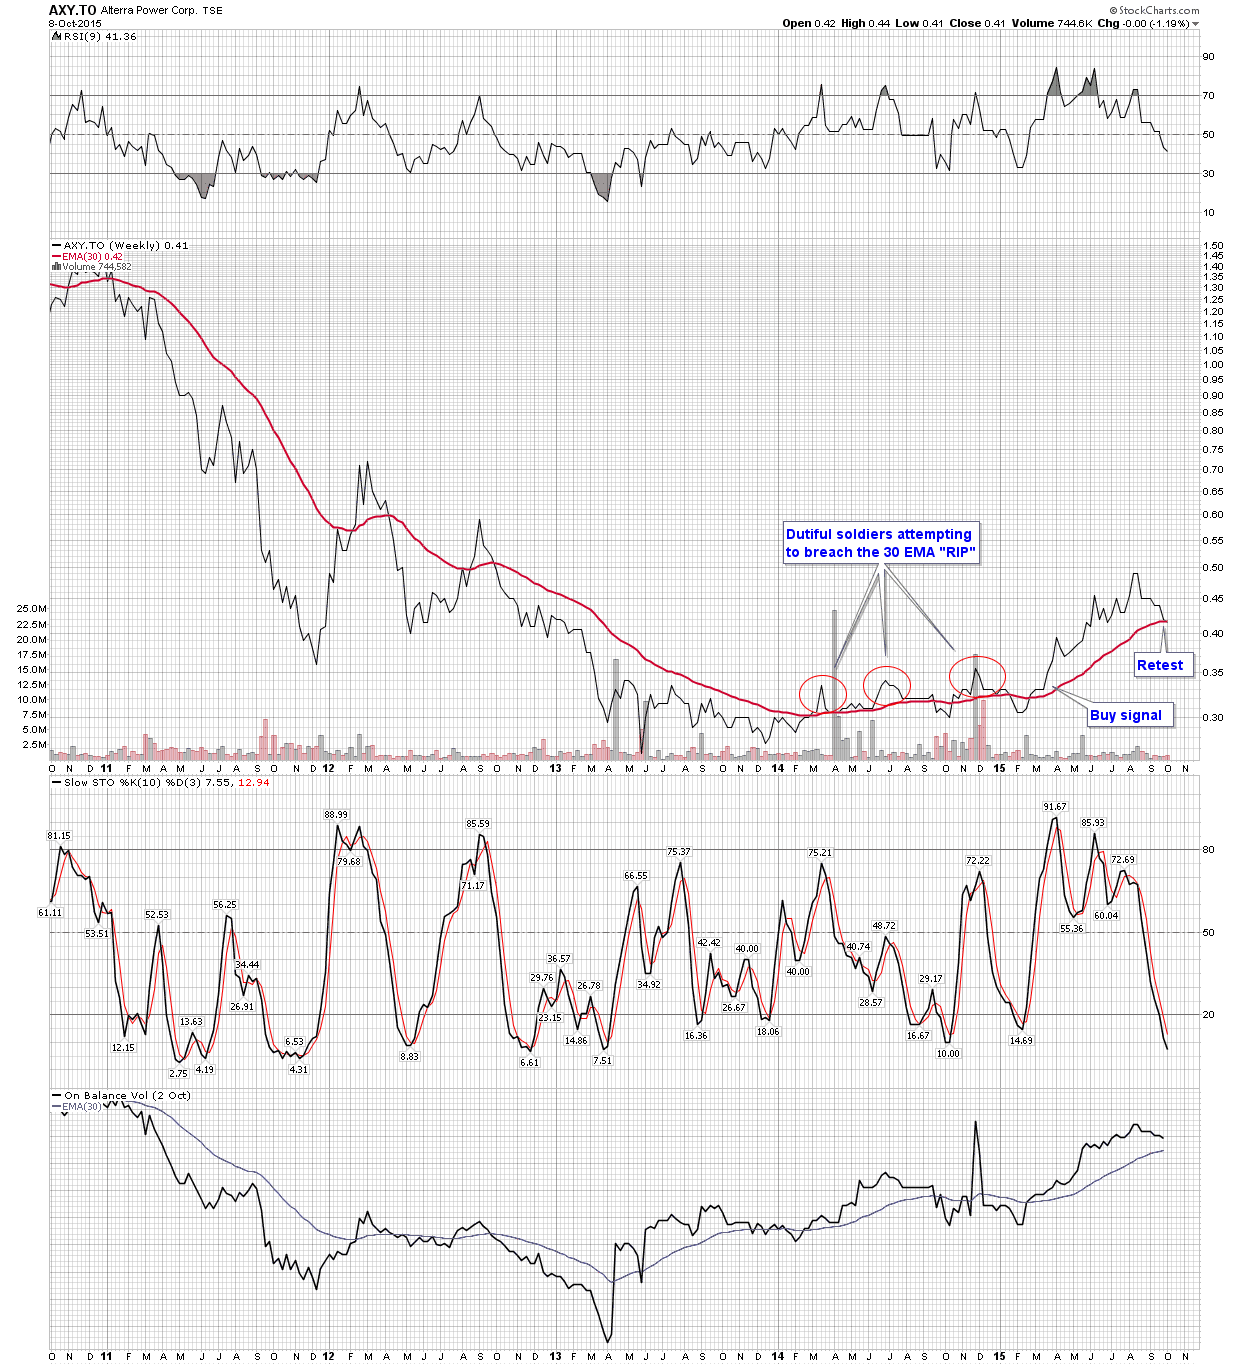
Take a look at how far from this process we are on a 5 year line chart:

And here is an example of the process when it has matured and actually formed that bottom. See how we have the dutiful little soldiers all trying but failing to breach then sustain themselves above the 30 EMA. Then finally one successfully makes it over the wall and stays there. observe how it is a critical requirement that the 30 EMA is actually pointed in an upward configuration and no longer tilted down. This must occur before we can have a sustained uptrend. This is how we must train our eye to look for. Compare this chart with the current 30 EMA of the GDX… not even close
So the point of the exercise is this is likely just another flash in the pan. We don’t even have a breach of the 30 EMA. In fact it seems we may have just gotten repelled by it, not even being able to reach it. Hold your horses knights, sure you can trade it as you see fit, but lets not get on the bandwagon yet. If we don’t take a step back before you know it some of us may be out there buying half their net worth in silver leaps like another infamous newsletter writer who lurks out there
A huge reversal yesterday in PM. Inverted hammer. DUST recover big time by close.
AND now gold is up and once again trying to go above 1156. If gold closes above 1157 long term bull has arrived.
It will breach trend line from 2011 covering all the price points.
Will that make bull ???????
My shorts are looking sad this morning!
Plunger: Its either a short cover rally, or something else. Just in case its something else, I am all in long. If its just a short cover, then I exit, and go short again.