Sunday Morning Thoughts
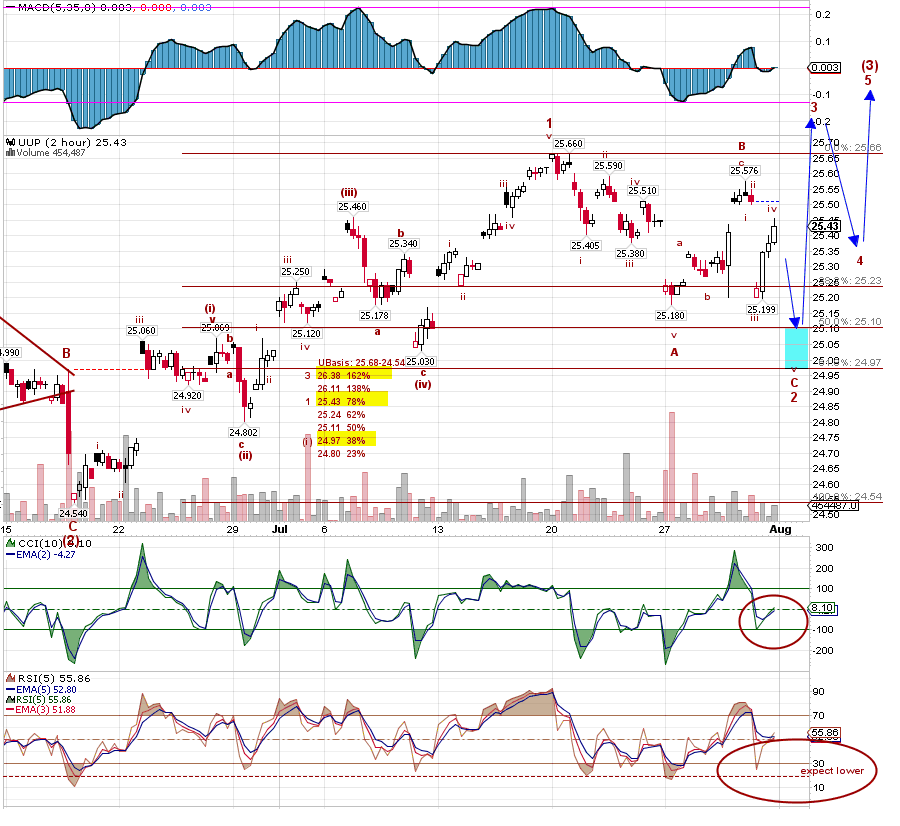
Dollar: By my EW count we need a little more downside to complete the 2… CCI and RSI are telling me to expect lower pricing ahead… EWO likewise needs a lower low unless we call the 25.19 a double bottom which is not supported by EW count… BTW guys I’m in a minority on this chart — most see the dollar going higher…. hmmmm……
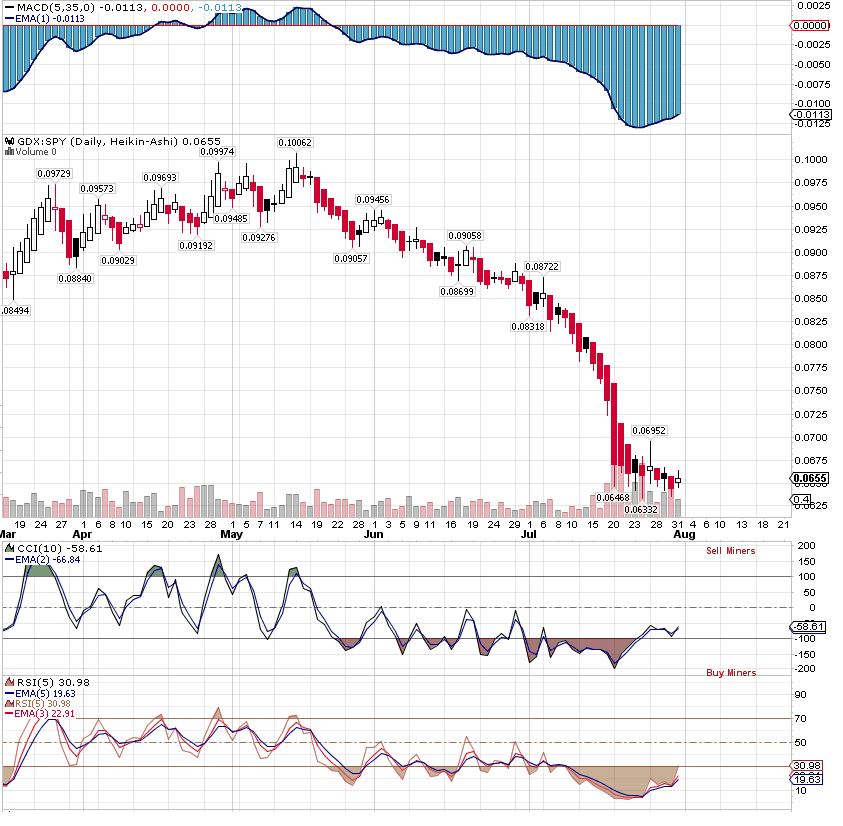
GDX:SPY Daily: Bullish Chart. Trigger line crosses. Price Divergence. Note this is a Heikin-Ashi Chart…
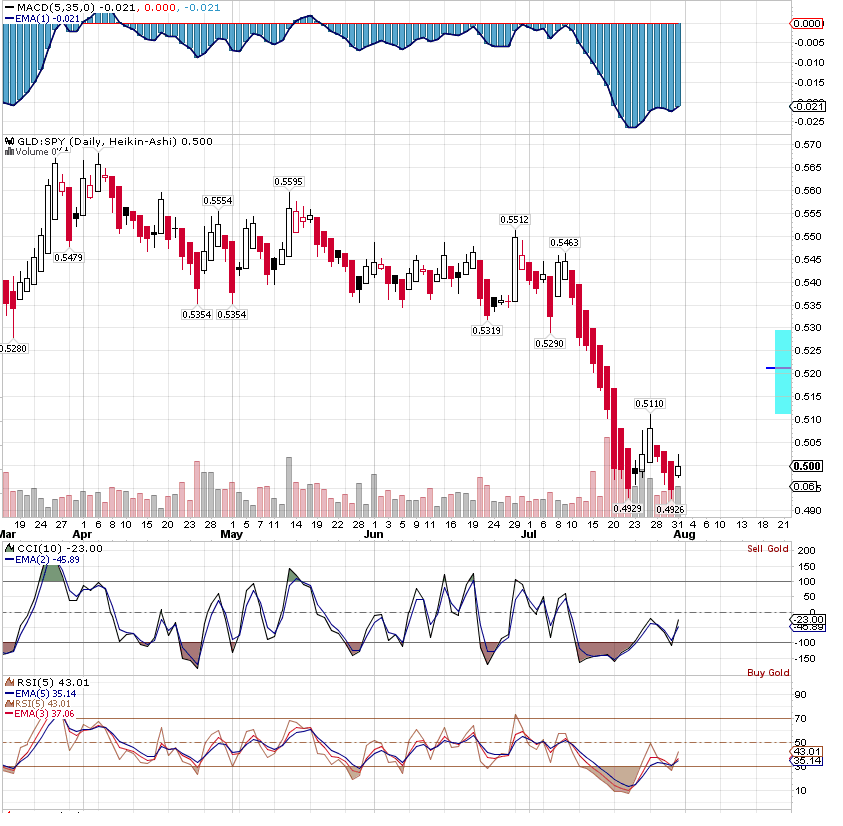
GLD:SPY Daily: Bullish Chart. Trigger line crosses.. Double bottom with target highlighted. Also a Heikin-Ashi Chart…..
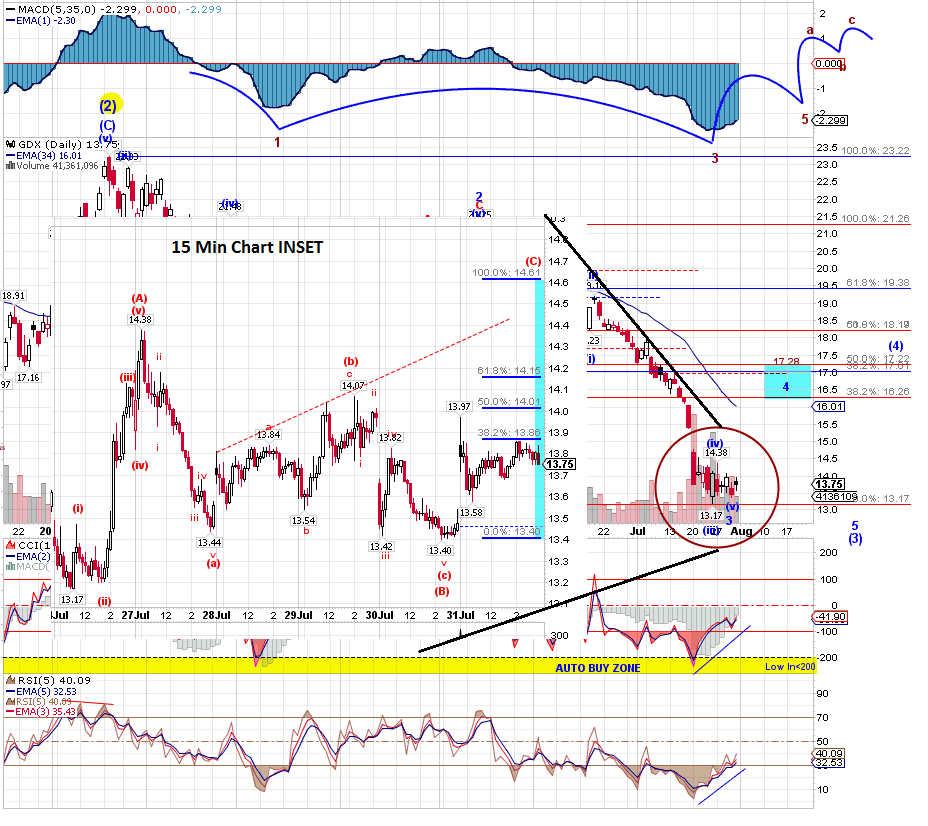
GDX Daily: Bullish Chart. Trigger line crosses. Price divergence. Still a question of what wave 4 we’re in. 15 Min Chart Inset says we’re in smaller wave 4 up BUT this also looks like a triangle… hmmmm….. The fact that the Daily chart is bullish is a big deal and favors more upside….
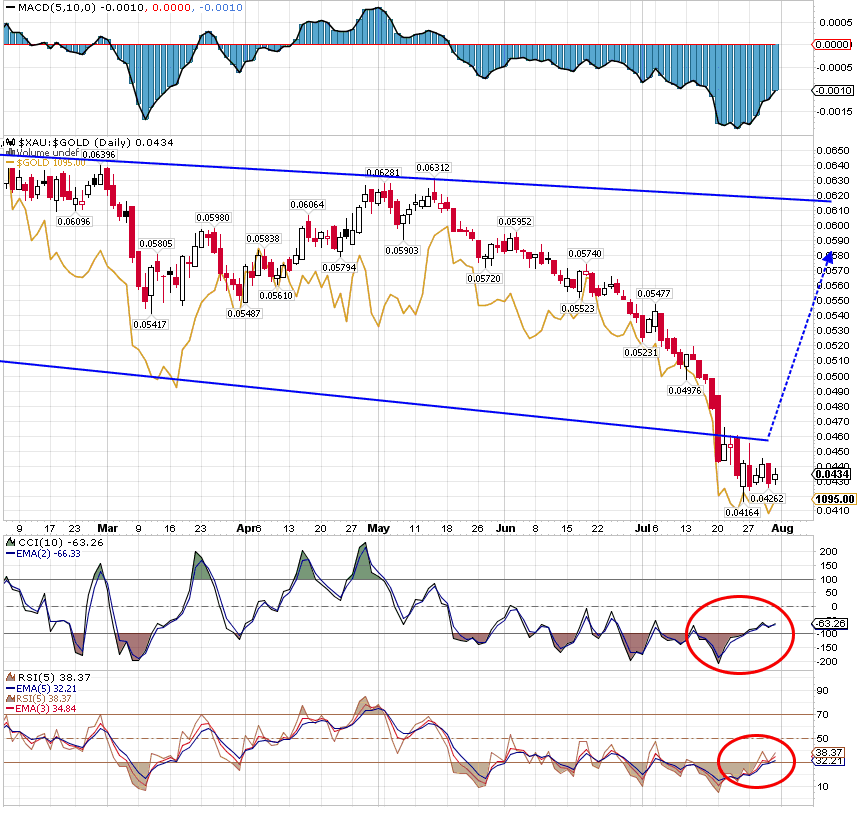
Clive’s Index chart: Looks like another test of downtrend line coming… Chart is bullish with trigger line crosses… Remember the more tests of the trend line the greater the chances of moving above it…. Just Sayin’…..
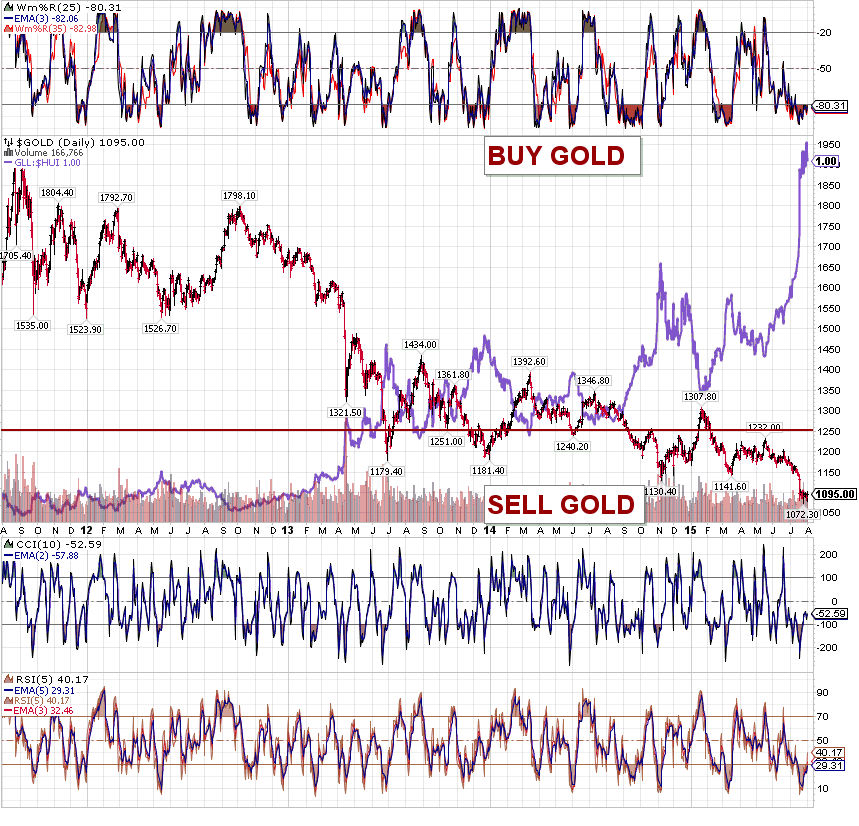
Clive’s Buy/Sell Gold at Extremes Chart: Pretty Extreme… and Bullish….
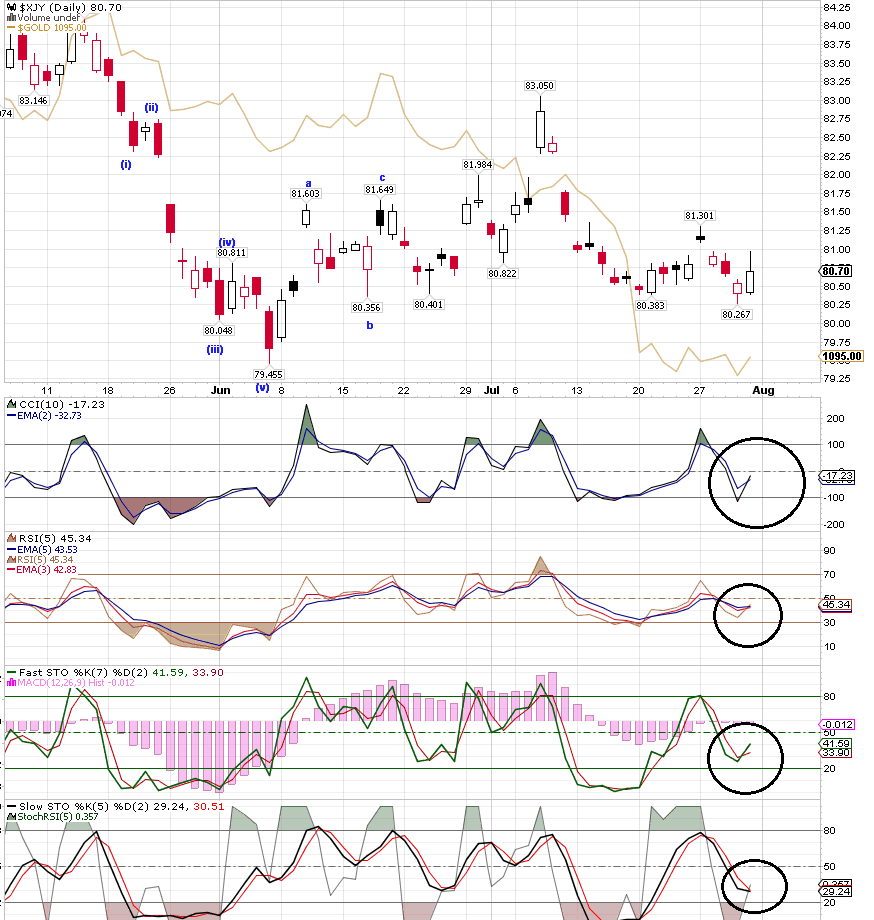
YEN Daily: Trigger line crosses to upside. Gold follows YEN….. Matrix Rules!!!!
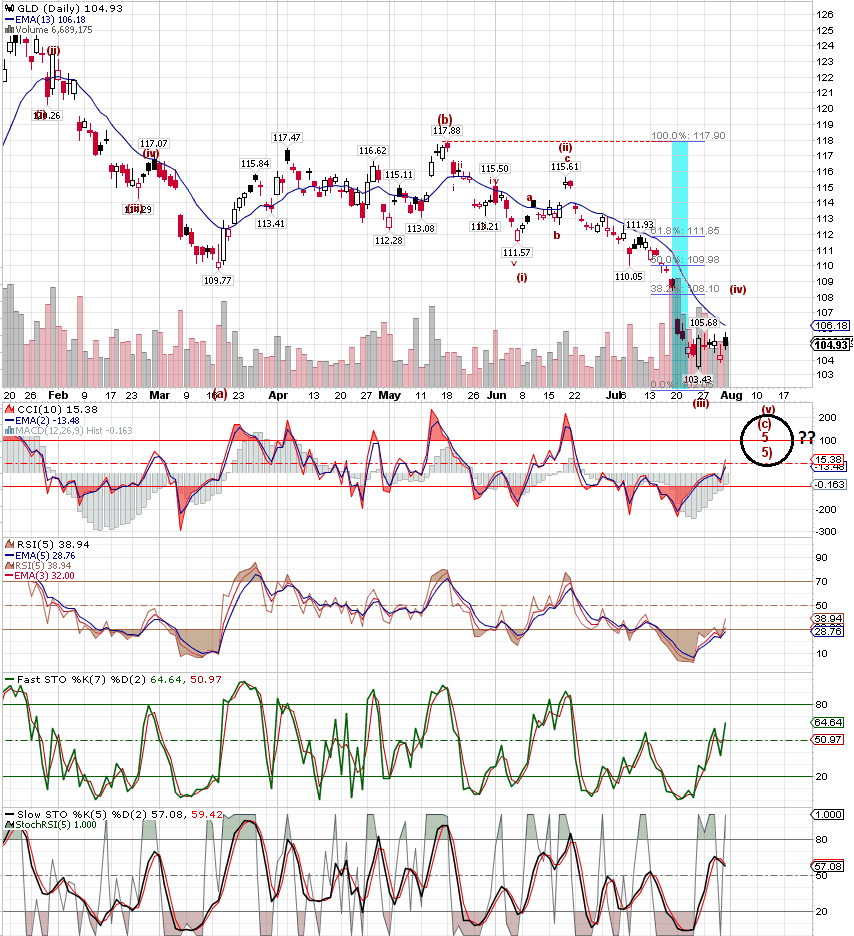
GLD Daily: Looks like (iii) has completed and we’re in wave (iv) up – target: close the gap… this is the smaller wave 4 not the larger wave four… if we exceed the gap then in all likely hood it’s the larger 4…. That black oxy is a little concerning since it means a trend change and SlowSTO pointing down – we’ll “ass-u-me” up since it looks like the minuette ii has just completed….