GDX Morning Update
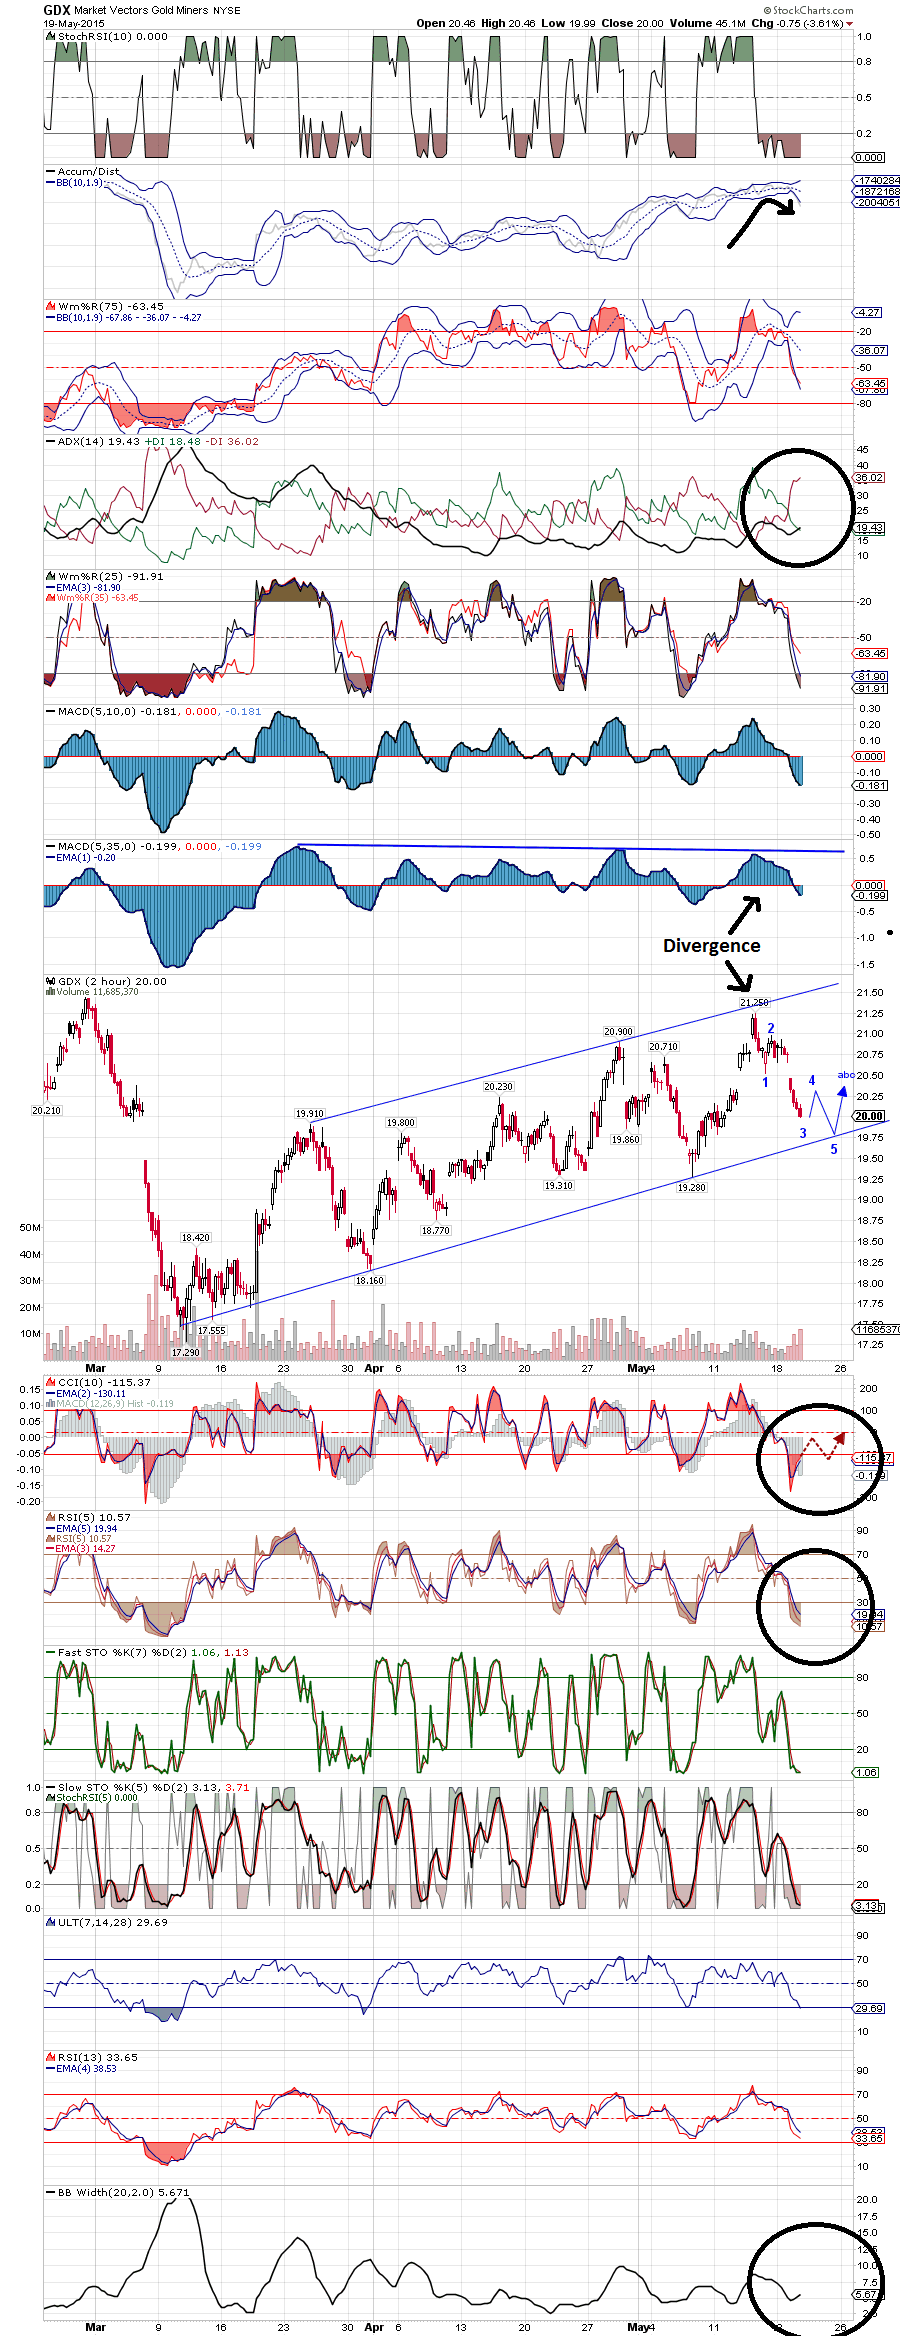
GDX 2 HR Chart: Trend looks down but then this IS the 2HR chart… EWO Price Divergence achieved (last high of 21.25 was actually a failed 3-PushUp!!!)…. Near term EW suggests small wave 4 corrective with wave 5 down to come (Note that the wave 3 from yesterday may not yet be finished e.g., a little more downside before we correct back up in 4 then down again to complete a 5)…. may find support at channel bottom… Right now, this moment, the Bull is still alive until we break through the channel support
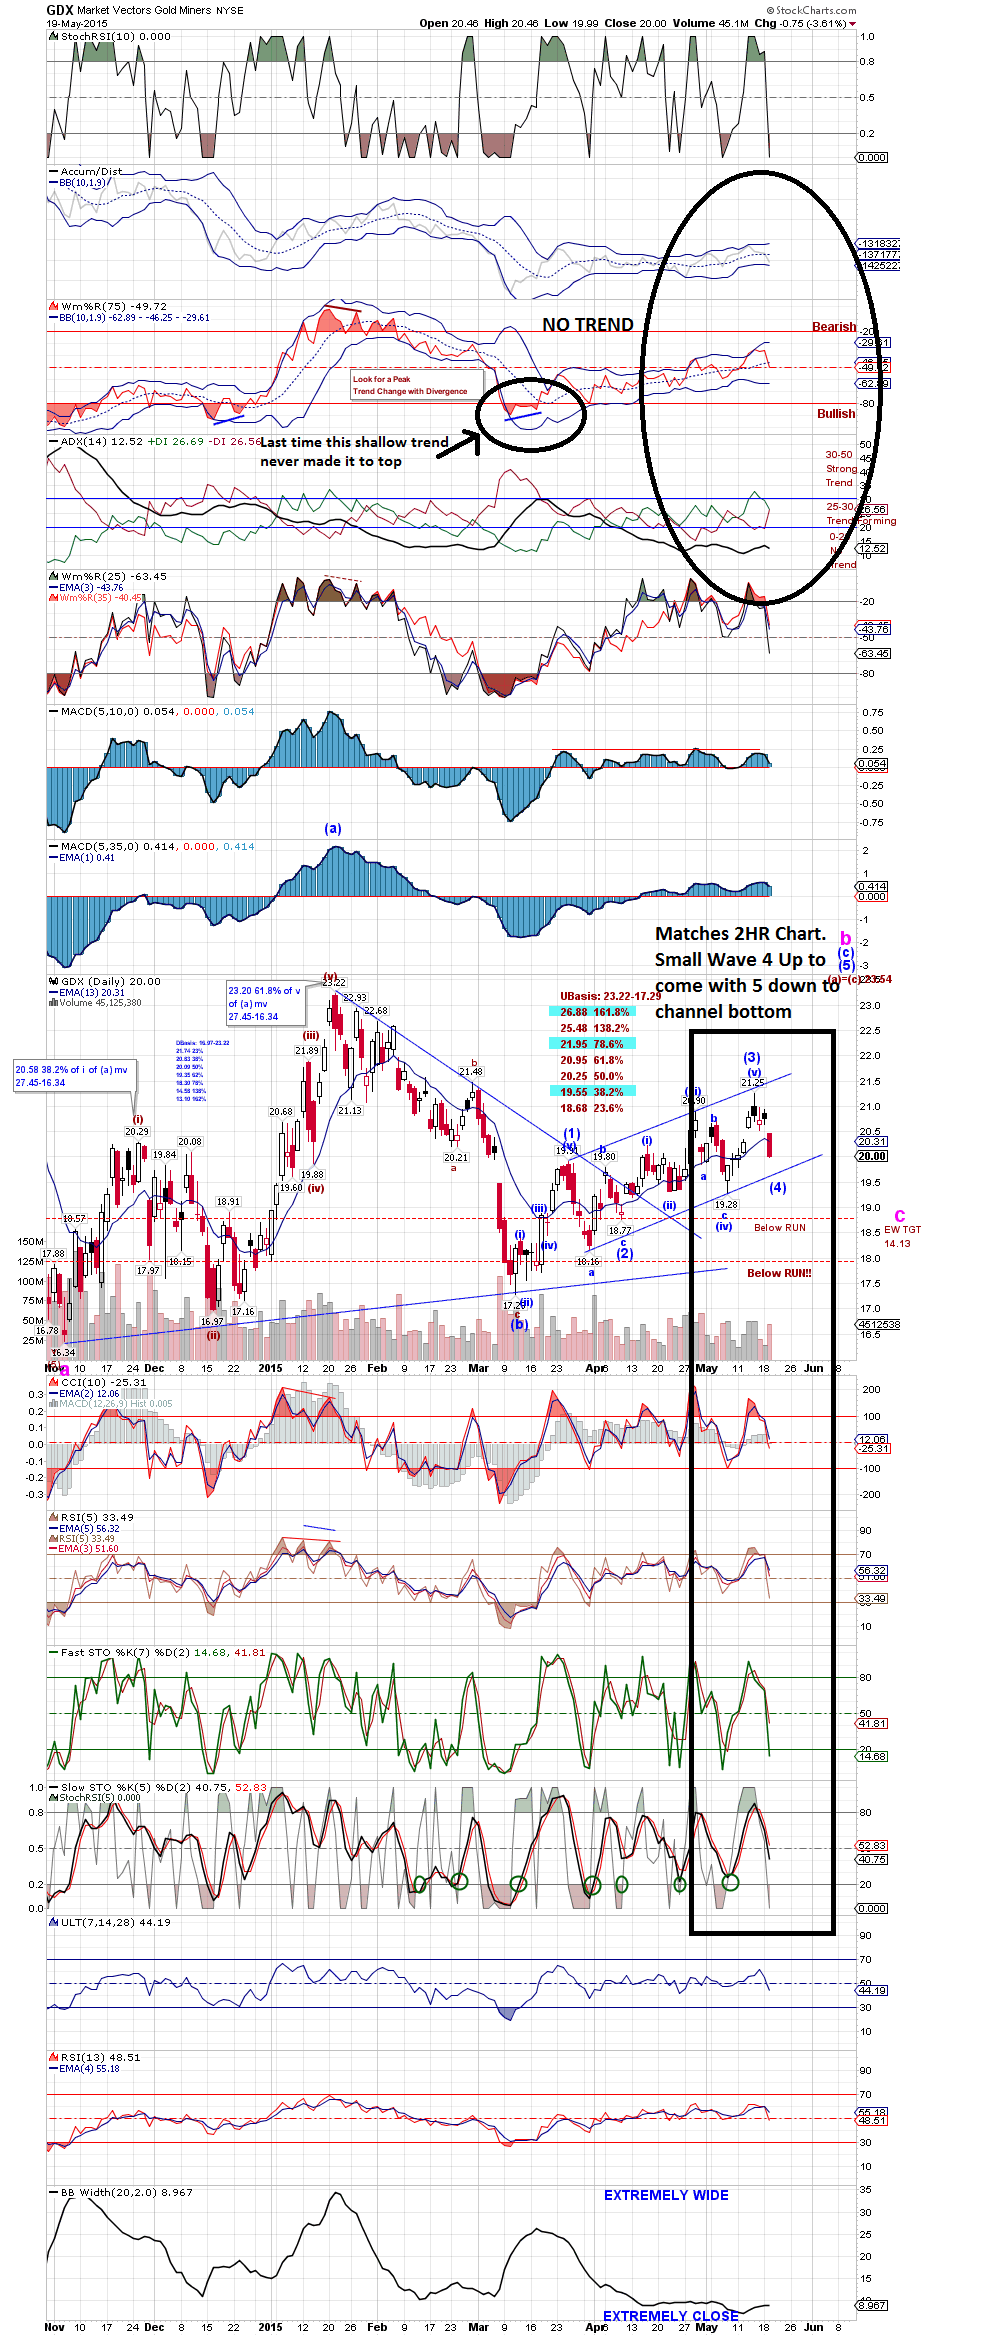
GDX Daily Chart: no surprises but trend is worrisome….
like the charts.. thanks trektrader….
could see the dollar pull back some today.. if the pull back is shallow.. beware… as it would form a reverse head and shoulder on the 4 hour.. this ties into your charts that we get a small wave up on gdx.. and then backdown.. one thing that is a little bothersome with the dollar.. if it reverses back up out of that reverse head and shoulder (which has yet to form).. potential dollar target might be the recent highs?????
Agree just posted UUP chart… most folks I read think 103 Dollar is in the cards… UUP is a pretty bullish chart… Now the question is how much will it affect mining stocks…