Chart from 7/1 – GDXJ

I was highlighting perceived risk after receiving so many comments about being militantly short at resistance levels and how risky it was to be anything but long during a parabolic gappy rise after gold almost exactly nailed my fib target of $1,371. I thought a 3rd wave was supposed to plough through resistance at those levels and the next stop for gold was $1,500+? Yes, I’m annoyed by some recent comments when I’m about the only one who isn’t even peddling a paid service. I feel like if you are any good at trading, you should get rich with your own trading capital and not subscription fees. My philosophy is building positions at good risk/reward levels, understanding structure, as well as support and resistance. If people are going to be more critical of me just because they are having a bad trading day then this is my last post here.

GDXJ

$USD

Charts speak louder than words. I know many will claim this time is different.

USD

Bonds Tipped Us Off Again

The breakdown of the exhaustion sequence in TLT once again tipped off the move in the GDX.

TLT

DGAZ Update

Trucking ahead to our next fib target en route to $13+. Yes, amazingly buying support and selling resistance still works 😉

DGAZ

As I’ve pointed out in the past, there are many structural similarities between the PM and Natgas markets/charts right now.

Natgas

GDXJ + GDX

Not sure how anyone could have seen this coming 😉 Don’t worry, the airy exhaustion gap sequence below should provide good support.

GDXJ

GDX

Krystar – here is one of the parabola charts I was following:

GDX

GDXJ Neckline Showing Cracks

Sometimes these supports simply collapse under their own weight and are particularly vulnerable to a swift move down when the underlying structure is so gappy. Nothing definitive yet but worth watching. Possible breach and backtest and now down….

GDXJ

3:20pm update – JDST breaking DT and falling wedge.

JDST

$NYA + S&P Update

As I was posting in May and June, the underlying strength in broader stocks, not just Dow and S&P, have been supporting this move to higher highs for some time now.

NYA

The bullish broadening pattern in the S&P I identified in May is playing out as expected.

SPX

Near term the S&P just hit my Wolfe Wave target identified at S&P 2000. Some pullback from here is expected.

Wolfe

Added for Ranchida – NYA Wolfe Wave scenario I’ve been watching since 9/2015

NYA

NEM

I know you guys think I’m crazy, but I still think NEM is heading to $28 from here.

NEM

Swiss Franc in Technical Trouble

XSF

TLT – GDX

Here’s an update of the TLT-GDX comparison chart I posted on June 2nd I believe. I was highlighting that the move/pattern break in bonds often executes a few days ahead of the same move in GDX. This was one of my charts that I used to support a move up on June 3rd. Well, I believe it’s now supporting the same countermove today. That is quite the exhaustion run topped with a possible island reversal in bonds….textbook if it plays out.

TLT GDX

CRB Monthly

While I thought the bullish crossover was a great risk/reward long opportunity 7 months ago, and prompted me to get very long oil and PMs, I’m not now watching the blue line closely for a backtest. If prices cant punch through, the whole commodities complex could be headed for a double bottom. I’m sure that would shock many people.

CRB

ABX Example – Some GDX Components on Thin Ice

ABX

GDX 15-min Update + DUST 5-min

I was looking at same charts as Eagle. I think the GDX 15 is too close to call but it closed right in area I expected. After a while these zones for closing start to become obvious. The market wants people betting both ways.

GDX

Now the DUST chart looks more definitive. In addition to buying more at $5.70 yesterday, I added some at $5.99 intraday and timed the buy with the GLD gap backfill. I do think the DUST chart is giving us a better clue than GDX.

DUST

GDX 15-min

I suspect it closes right on the lower rail to confuse the most numbers of traders going into tomorrow.

GDX

UGAZ

Does this chart structure look familiar to any others we may be following?

UGAZ

May 26 Target of $1,371 hit

Gold

and some claim TA doesn’t work 😉

Gold Daily – DT Tag and Fib Levels

I found this fib fit interesting, especially as prices hit the DT resistance. Last month I suggested $1,371 and it’s getting tagged.

Gold Daily

GDX Weekly – Originally from Dec 2015

Some may recall this chart I posted last Dec when I noted OBV was beginning to diverge from price action. I also noted a parabolic curve that was fitting price movements. Although most are dismissing any possible resistance coming into play, I still see it immediately on top of us. Collectively this looks like high risk long territory to me. Prices correcting back to the parabola wouldn’t shock me, perhaps making a higher low. Although I pretty much dismiss everything Armstrong says, this would fit his timing that gold may not be truly ready to make a sustainable move until 2018. Just throwing out some alternative scenarios we need to watch. Everything must be considered!

GDX Weekly

Updated GDX Charts Posted Fri

I suspected that we’d gap up today into resistance and that’s what happened. Instead of a dark candle this time with got a hanging man at resistance. I added to my DUST and still held my JDST.

GDX

GDX2

Everyone keeps calling these breakouts. They have all the hallmarks of exhaustion gap sequences.

Still watching GDX 15-min wedge:

GDX15

GDXJ – exhaustion into resistance with lots of selling last 2 hrs of today.

GDXJ

Gold & Silver

Here are two charts I created back in late May that I have not touched. I projected a measured move for gold….it has now hit the measured move…that doesn’t mean it cant go higher but I always sell when I reach targets. Silver chart is interesting…I projected a channel and it has spiked through the top yet was contained on the close with a crazy high volume, long tailed doji. Sensibly you sell into these types of moves.

GoldSilver

HUI Monthly – Another View of Resistance

Question: Do successful traders not sell into strength at resistance and buy into support on weakness?

HUI

Misplaced Certainty that this is a Bull Market in Gold

If there is one recurring theme I hear echoed daily on here is this notion that we know with some level of certainty that we are undeniably in the early periods of a long term bull market in precious metals. I’m not saying that we are not, and in fact I really like the set up here and supporting long term charts, but nobody knows where we are in the bull-bear cycle with certainty. The best we can do is try to interpret the data and place our bets so we have the best odds for success. We will only know in the rear-view mirror if our premise is correct…I don’t care if you use EW or any other form of TA, it can only be confirmed AFTER the fact.

Consider this monthly chart in gold going back to the early 80s. I bet 99% of the traders in 1982 thought with certainty that gold was resuming its bull market as prices made nearly a 38.2% bounce retrace of it’s earlier highs. Well folks, that’s exactly where we are today as well and I’m sure the sentiment is exactly the same now as back then. As you can see by my red arrows, it turned out to be a corrective move and it took gold another 18 years of wiggles and much basing before it made another run like people are expecting today. My point is not that I know the future…my point is NOBODY knows it and therefore I will continue to buy support and sell resistance, bagging profits along the way because only cash is certain.

Gold(Monthly)20160705131720

I find it interesting that the bounce in 1982 lasted 7 months and we are also in the 7th month of the current move.

Rising Wedge into Mega Resistance – Natgas Example

Good example of why risk/reward favors selling these setups with bearish structure and weakening internals (moneyflow/momentum). Yes, these charts look like the miner set up right now…and they don’t usually resolve gently in their correction.

Natgas

UGAZ

My DGAZ is back profitable with my average cost at the green line. DGAZ up more than 20% today.

DGAZ

Will post later an update of what I’m seeing for the miners but for now all my miner charts analysis from Fri are playing out as expected, including the gap up to resistance.

Perceived Risk

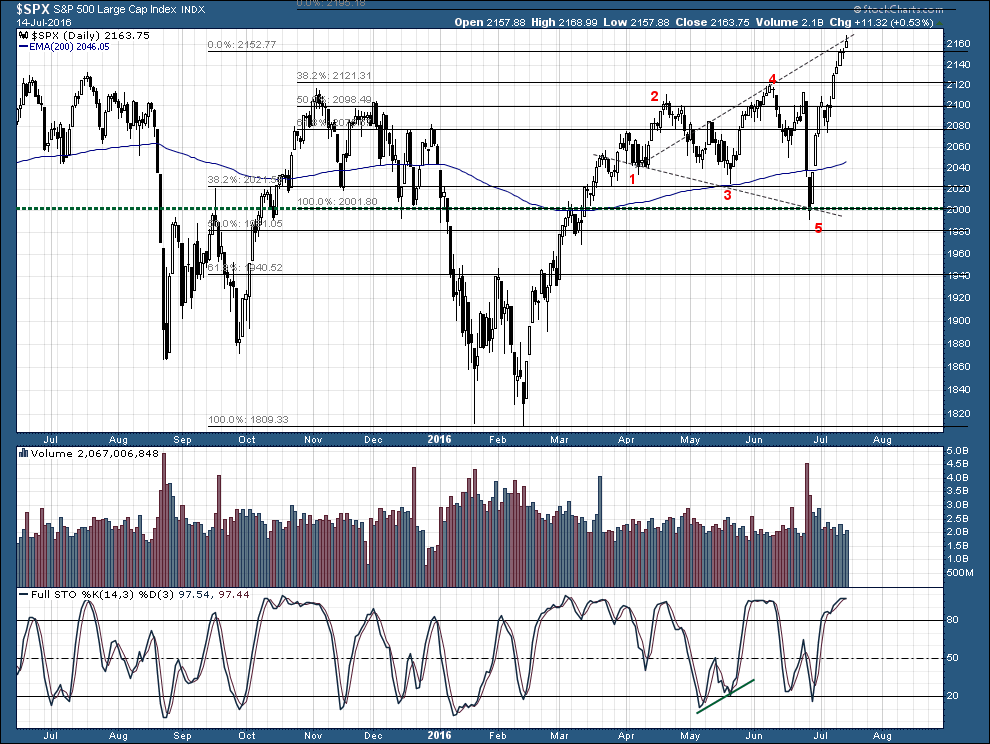
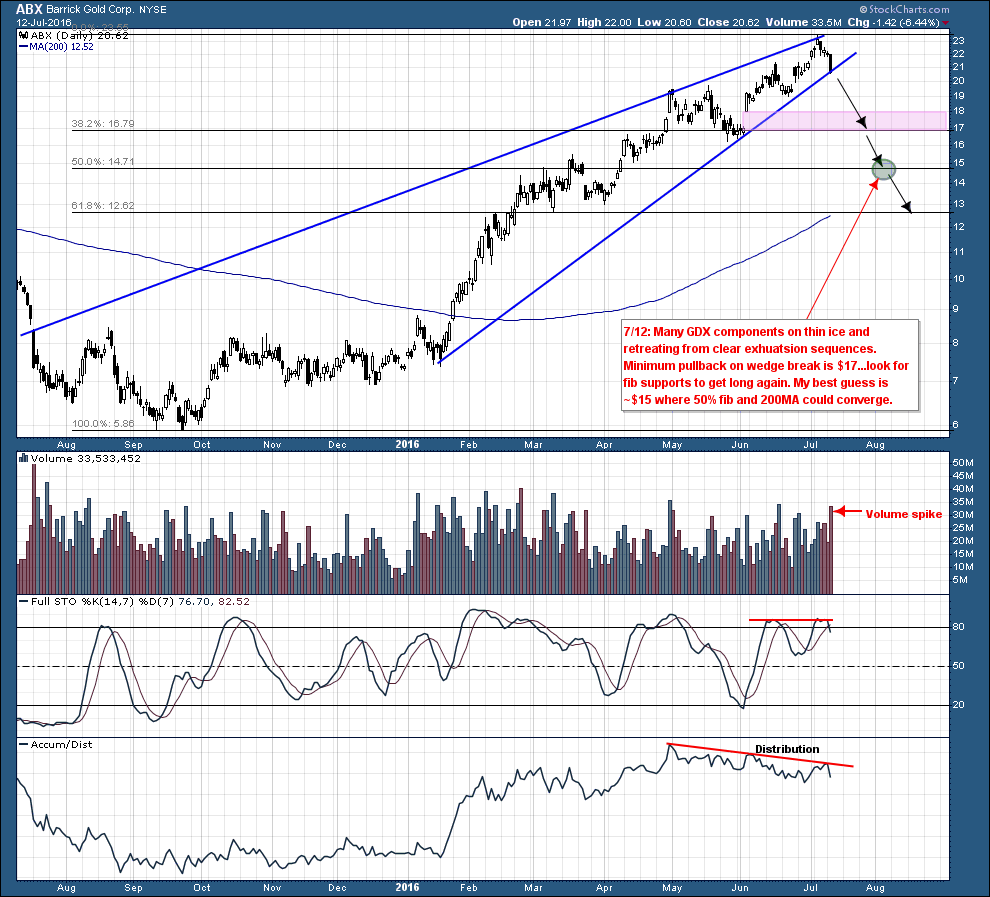
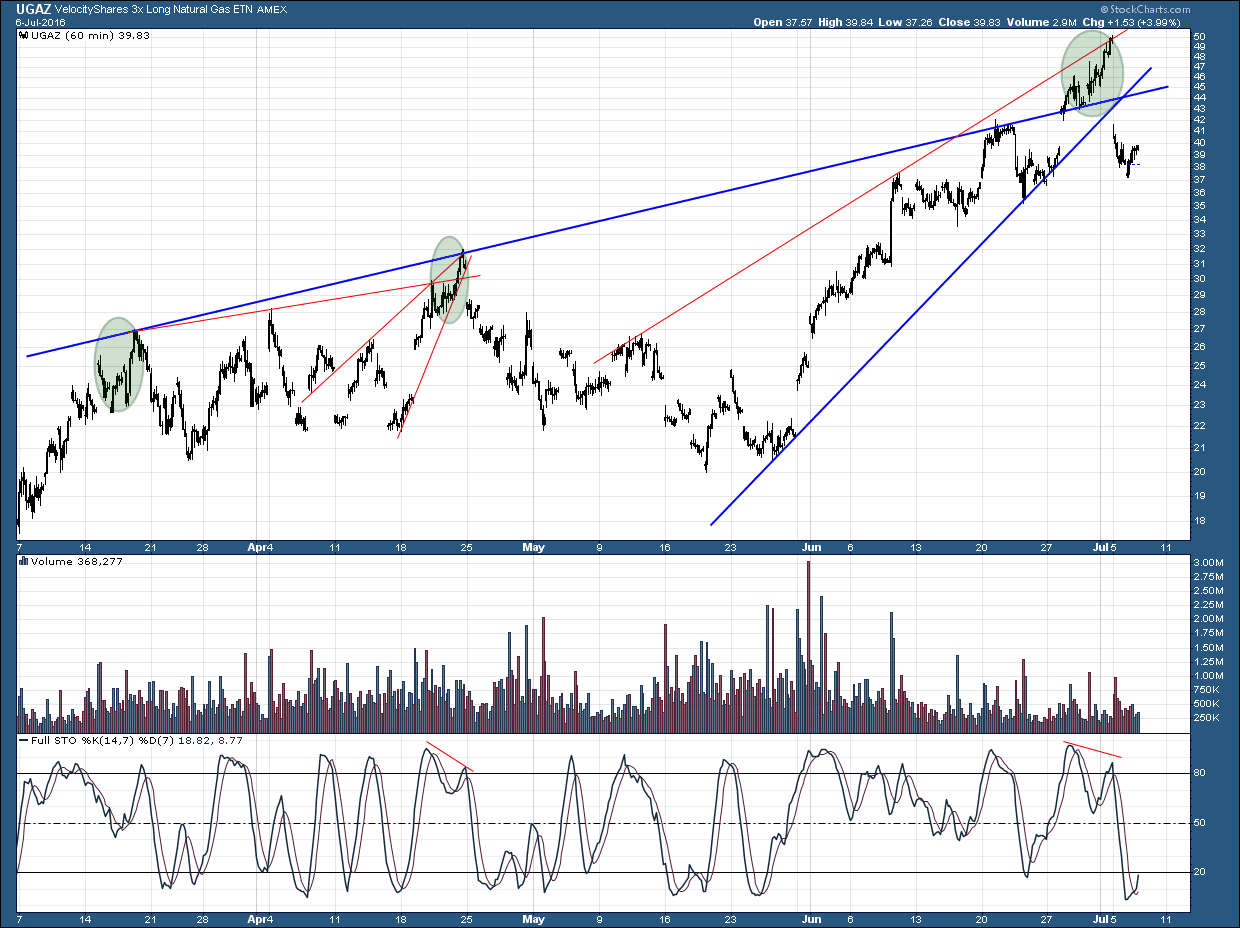
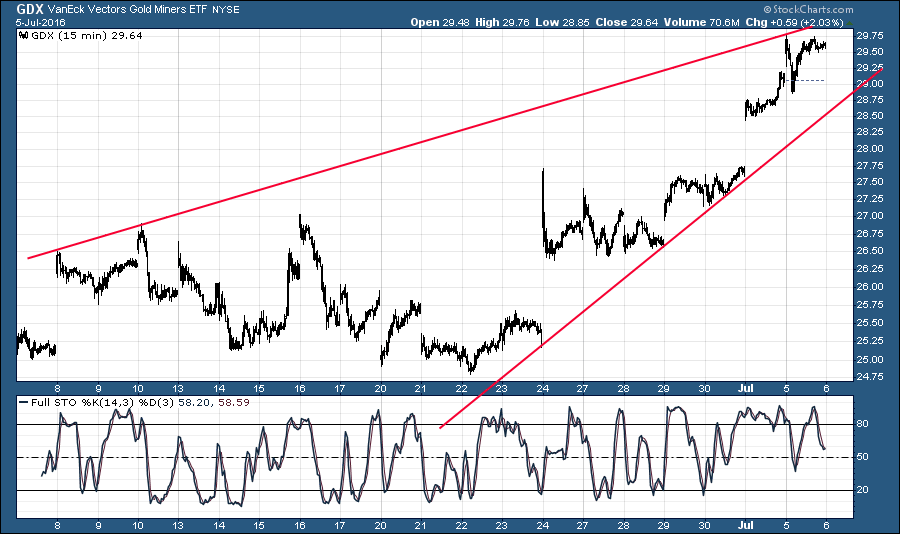
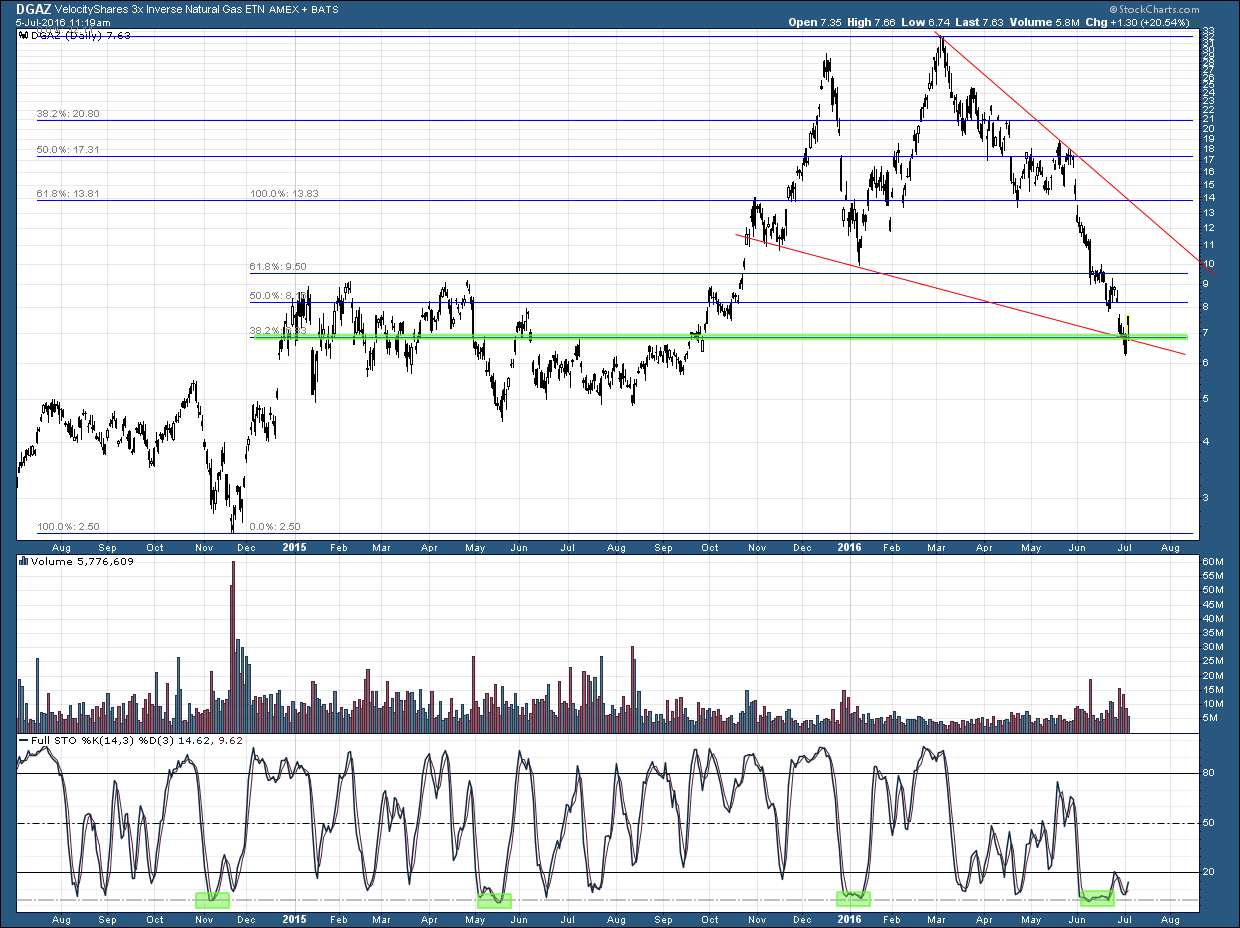
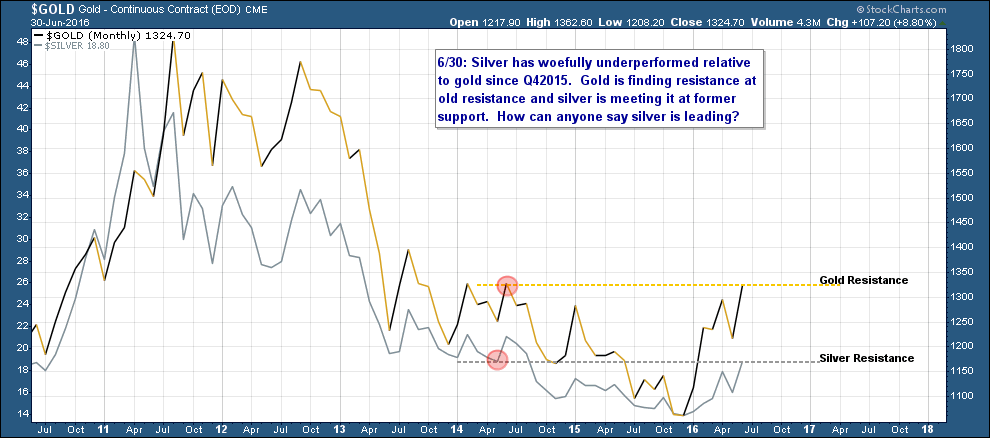
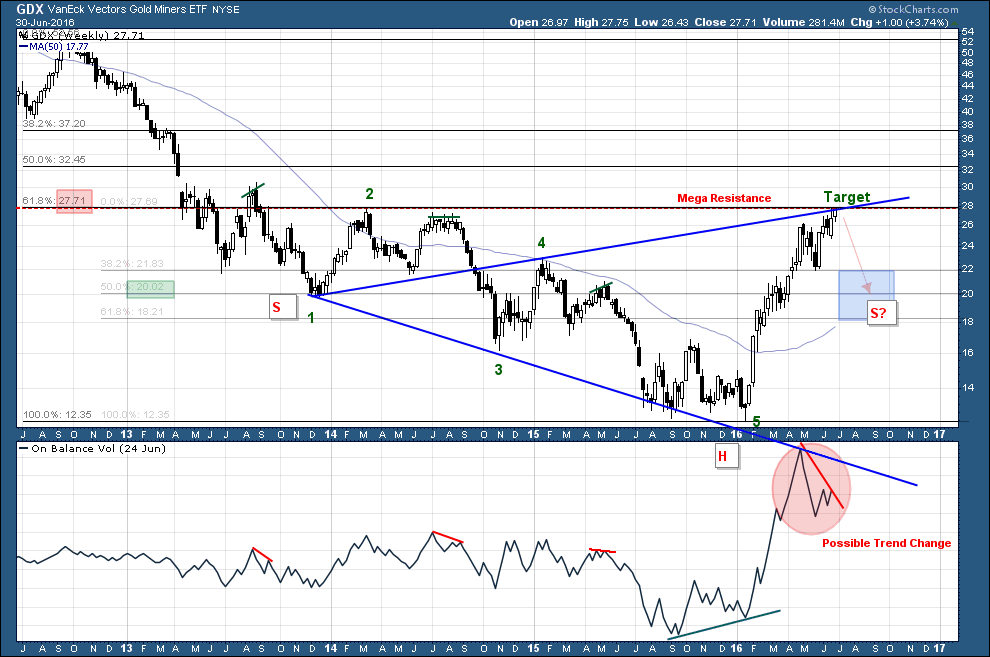
It sure feels risky when you put on an opposite-sided traded after an equity moves way into overextended territory. In all reality the prices that people feel are running like a freight train in one direction statistically carry awful odds of being maintained without correction. When you have a confluences of chart patterns, diverging momentum, diverging moneyflow, and historical resistance levels these are actually the safest times to enter an opposite trade but it never “feels” that way.

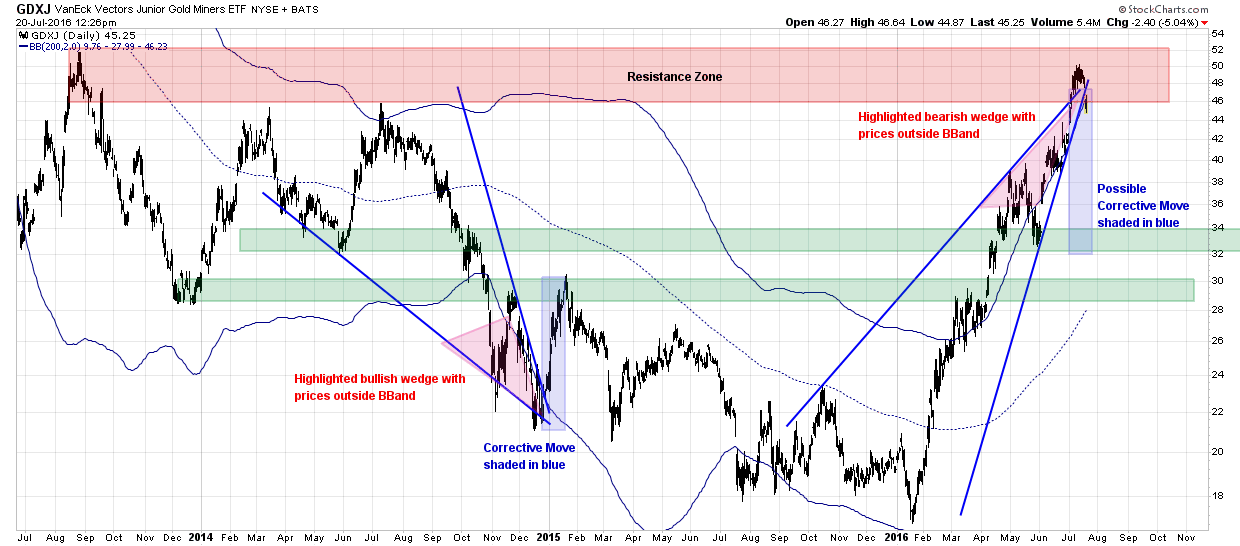
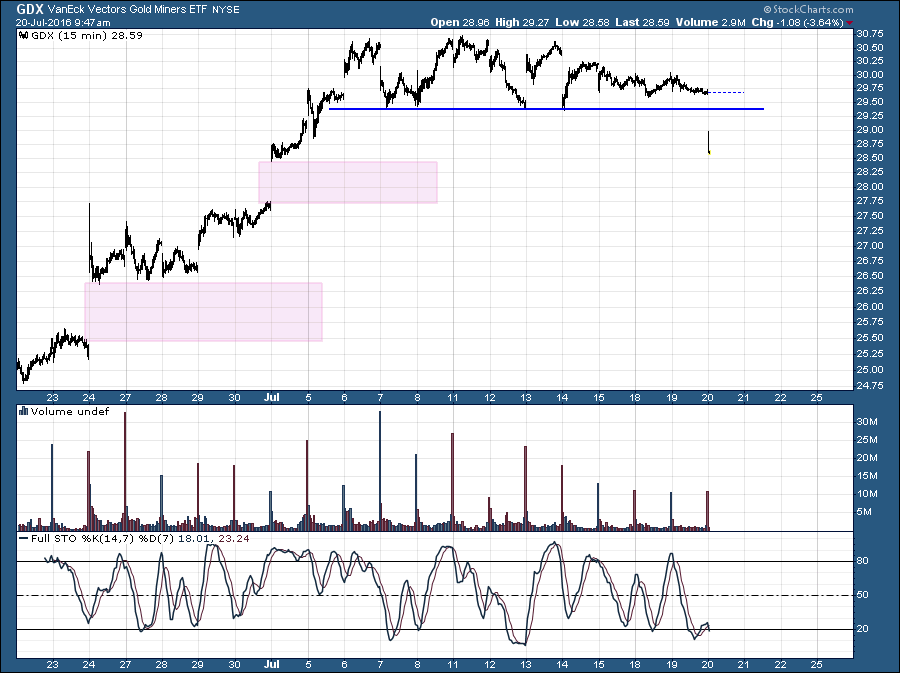
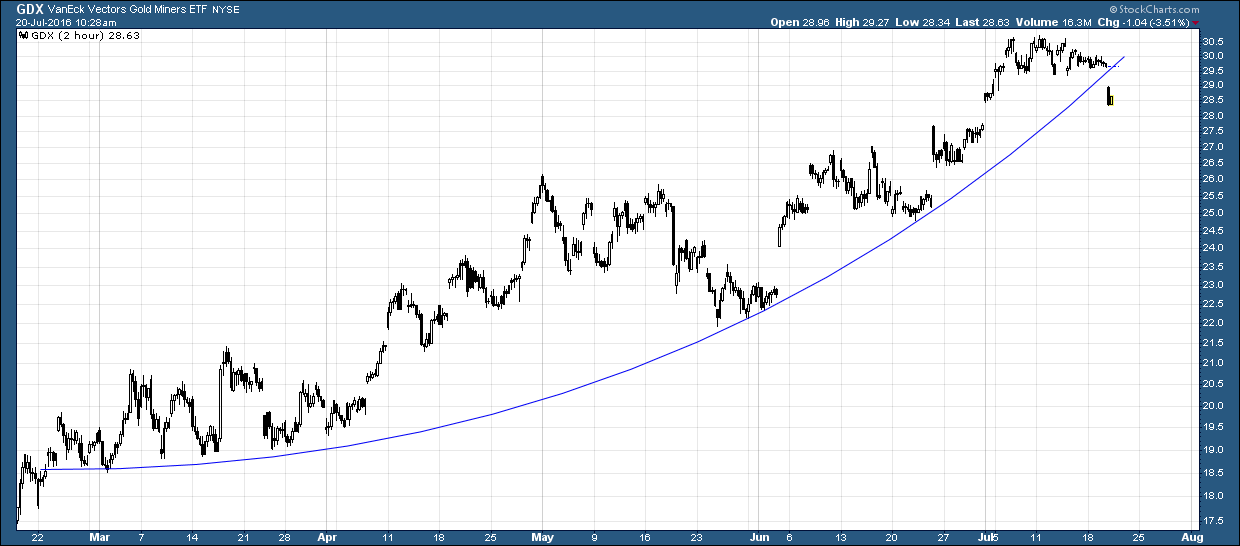
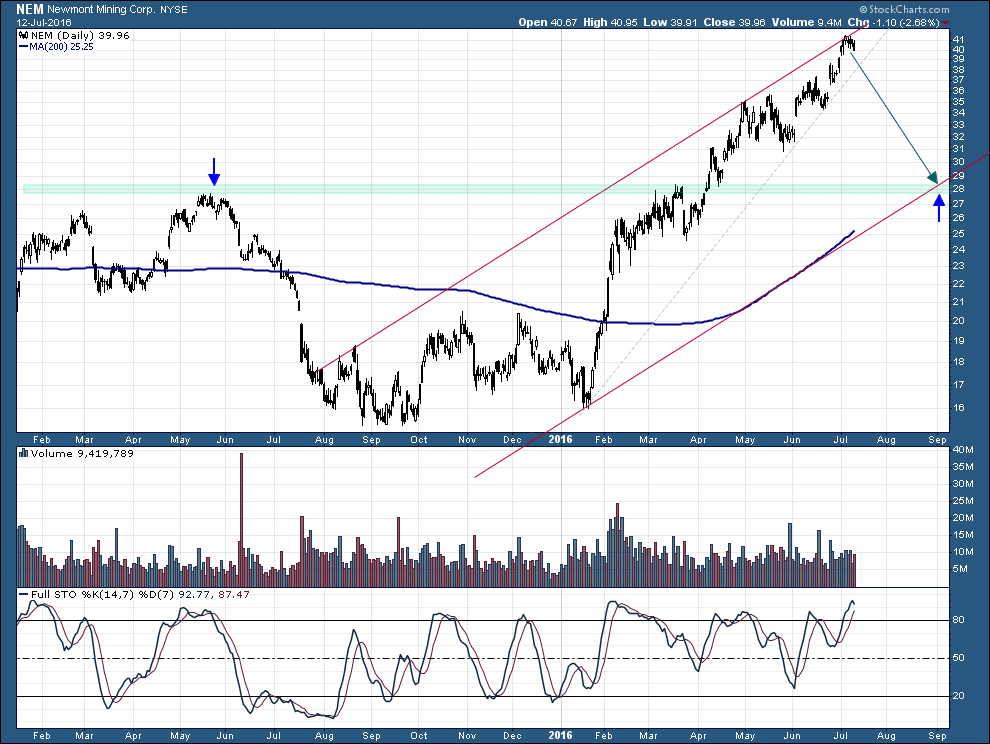
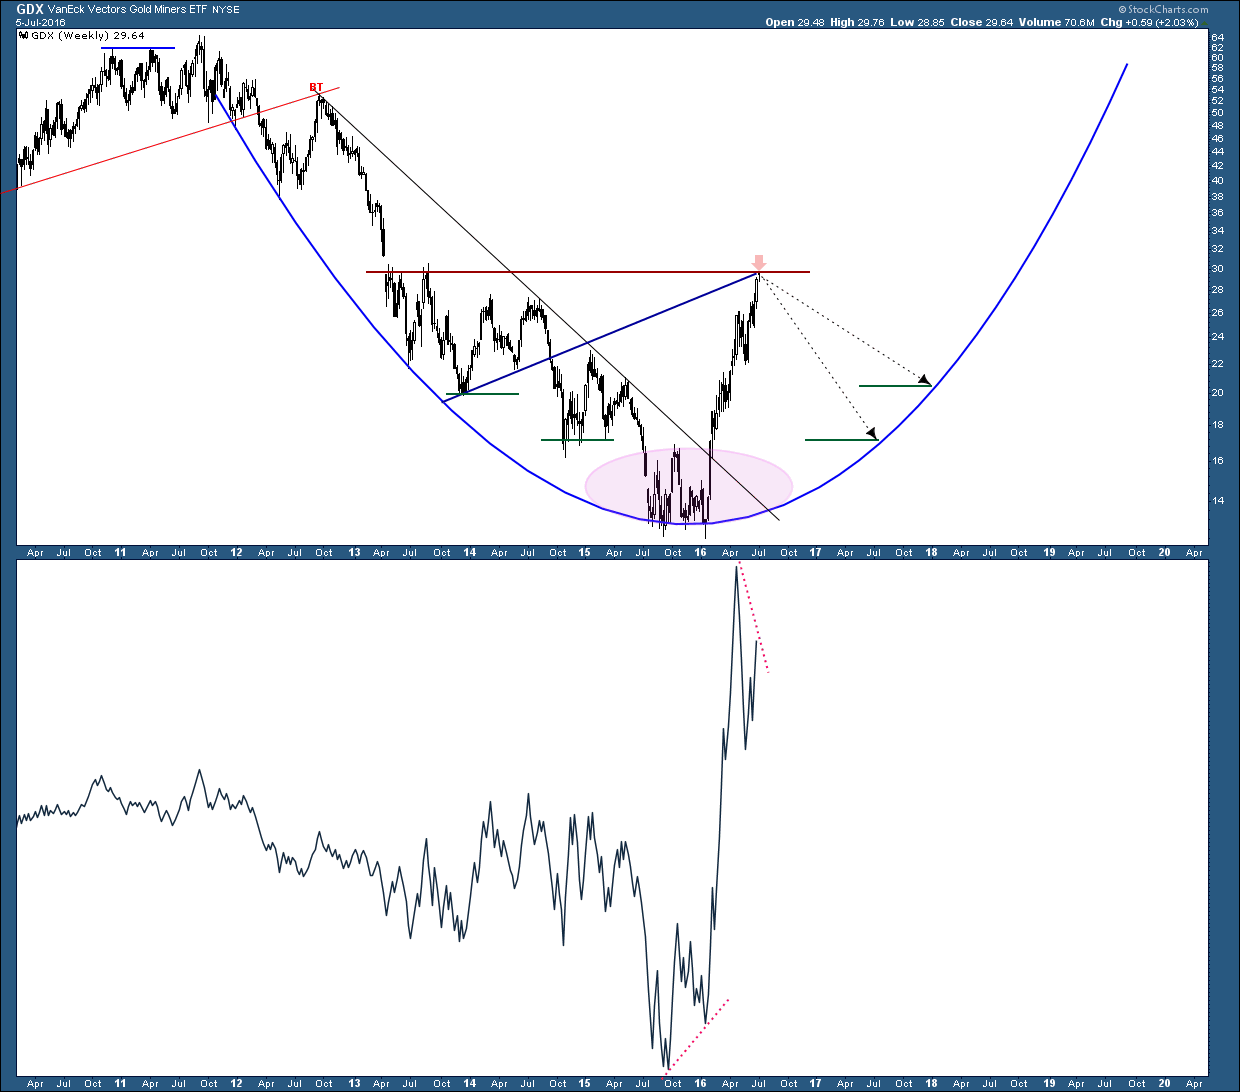
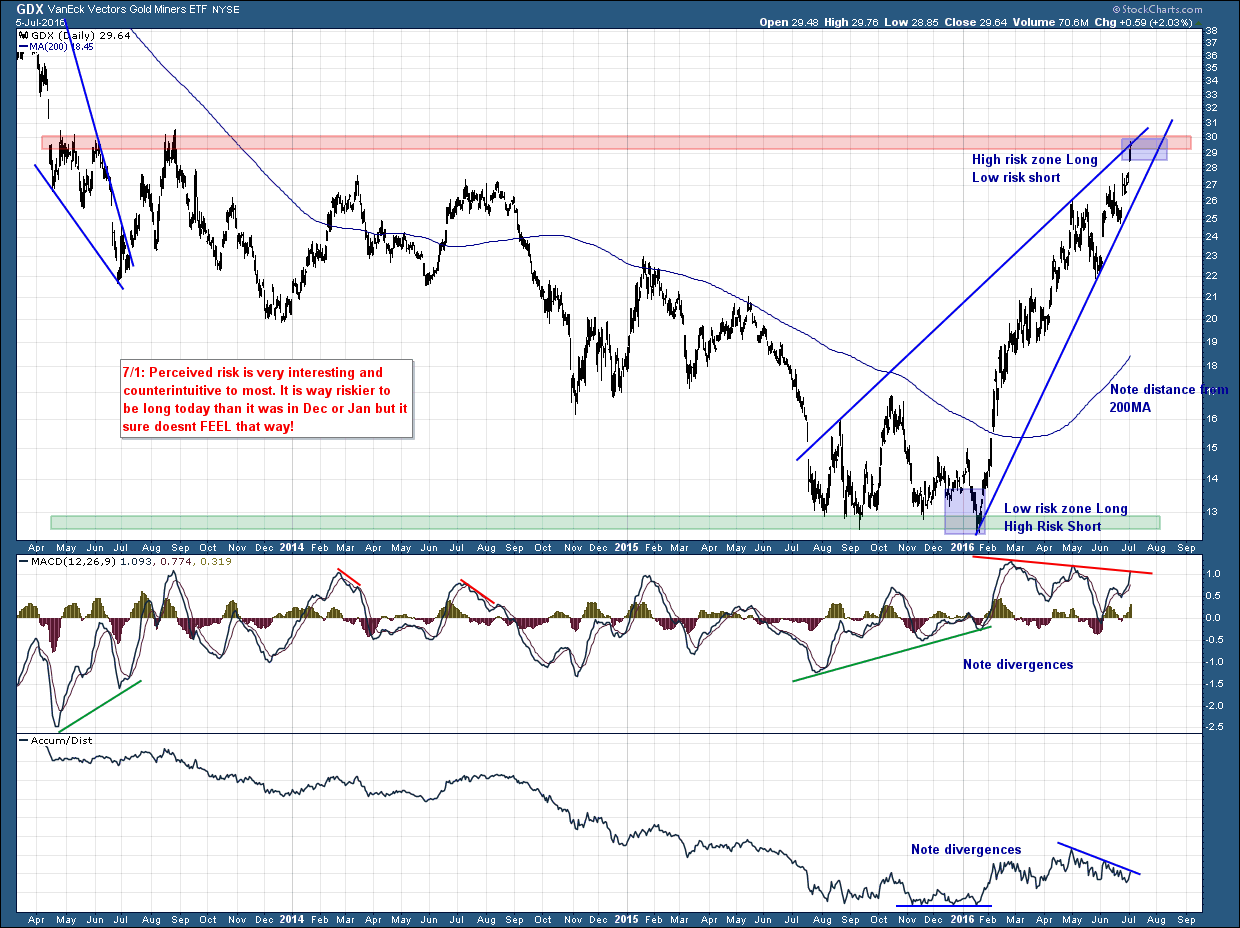
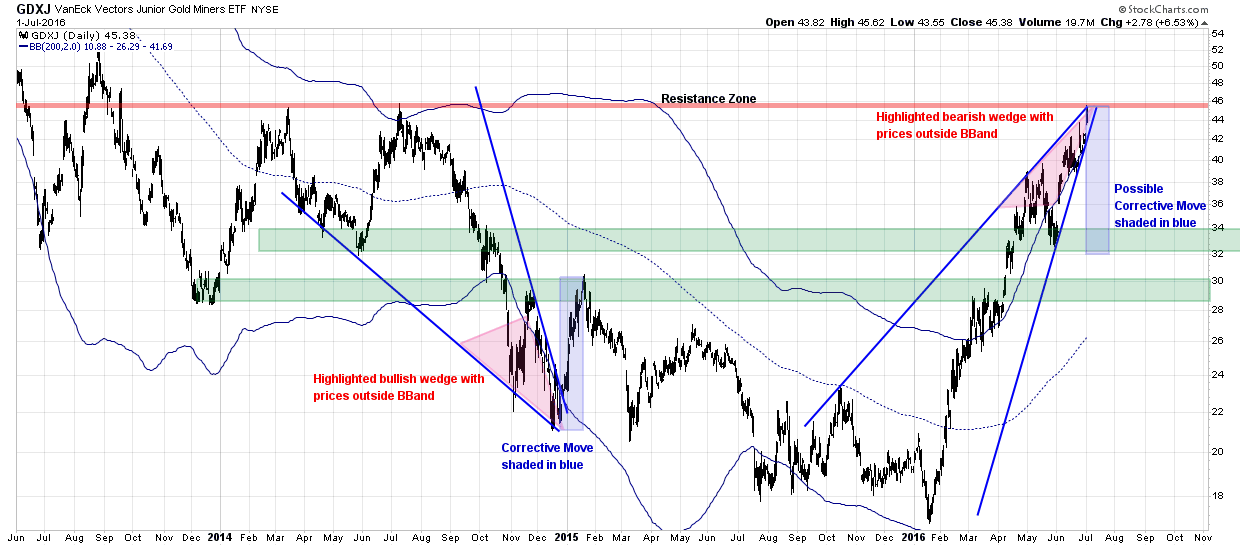
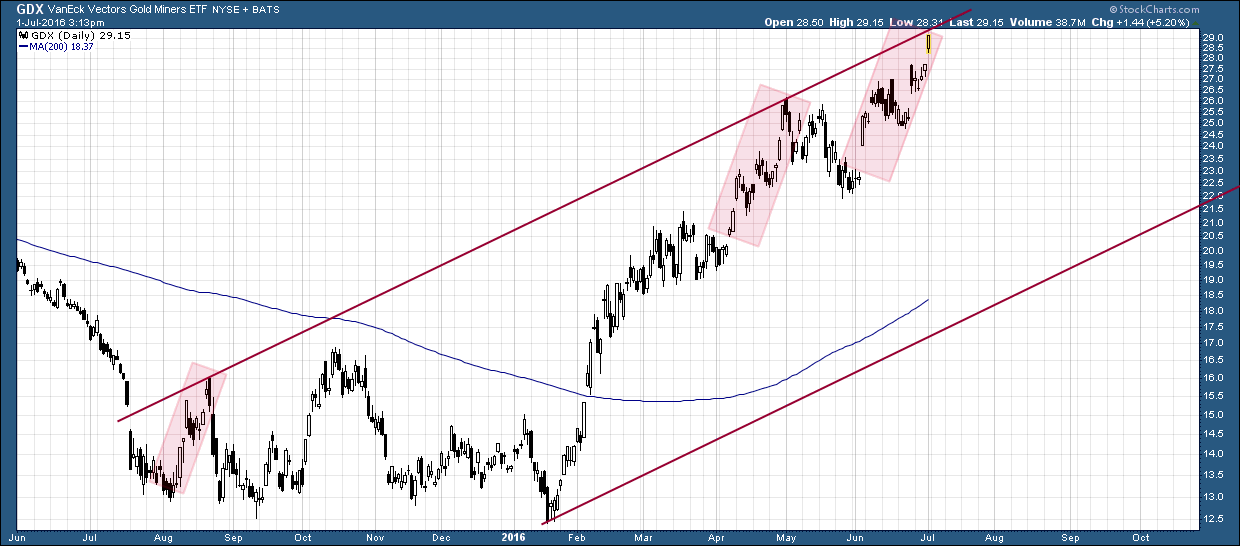
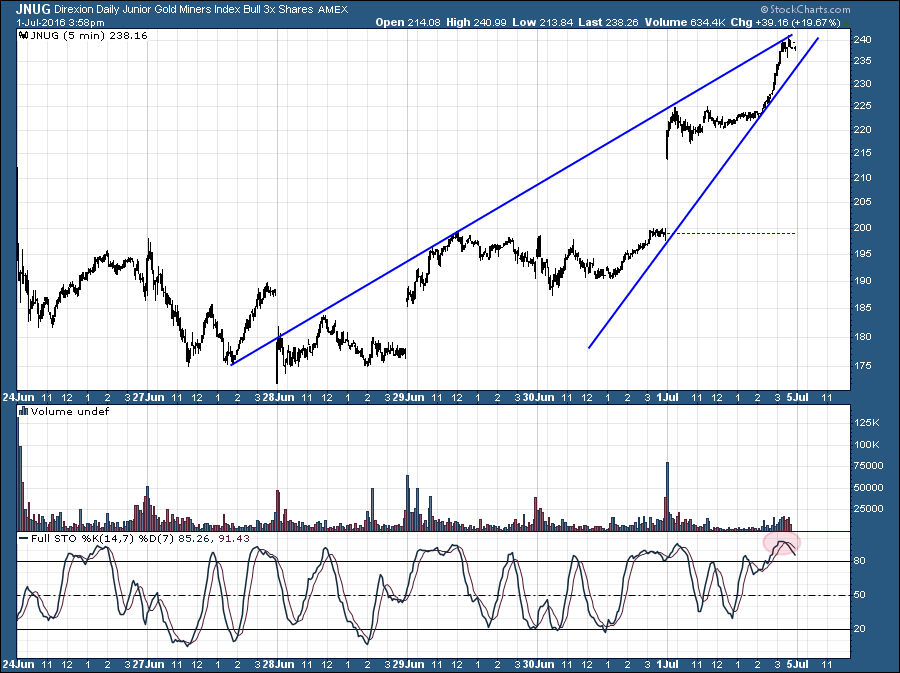
It seems like a long time ago now but back at the end of May I was pushing hard to encourage buying the dip to anything in the $22s GDX because we were pulling back to supportive MAs (for the first time after an impulsive move) and S/R levels with really solid moneyflow….it was clear people were buying the pullback. But I don’t think I heard anyone else on this forum agree with me. Even the most bullish of you said we haven’t consolidated long enough and even one of you (who will remain unnamed) said the evening before the swing low that he was selling on any further weakness the next morning because he was unwilling give up hard earned gains since Jan-Feb. Yep, the next day was the swing low. Emotionally we end up selling into weakness when we cant take the pain any longer. Others of you were selling partial positions within days of this swing low while I was loading up. Now I sell into strength the day after Brexit, have scaled into short positions and have become the resident idiot 😉 Consider this chart and think about which entries and exits are truly this riskiest, setting your emotions aside.

GDX

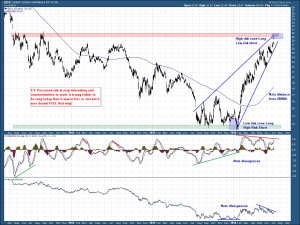
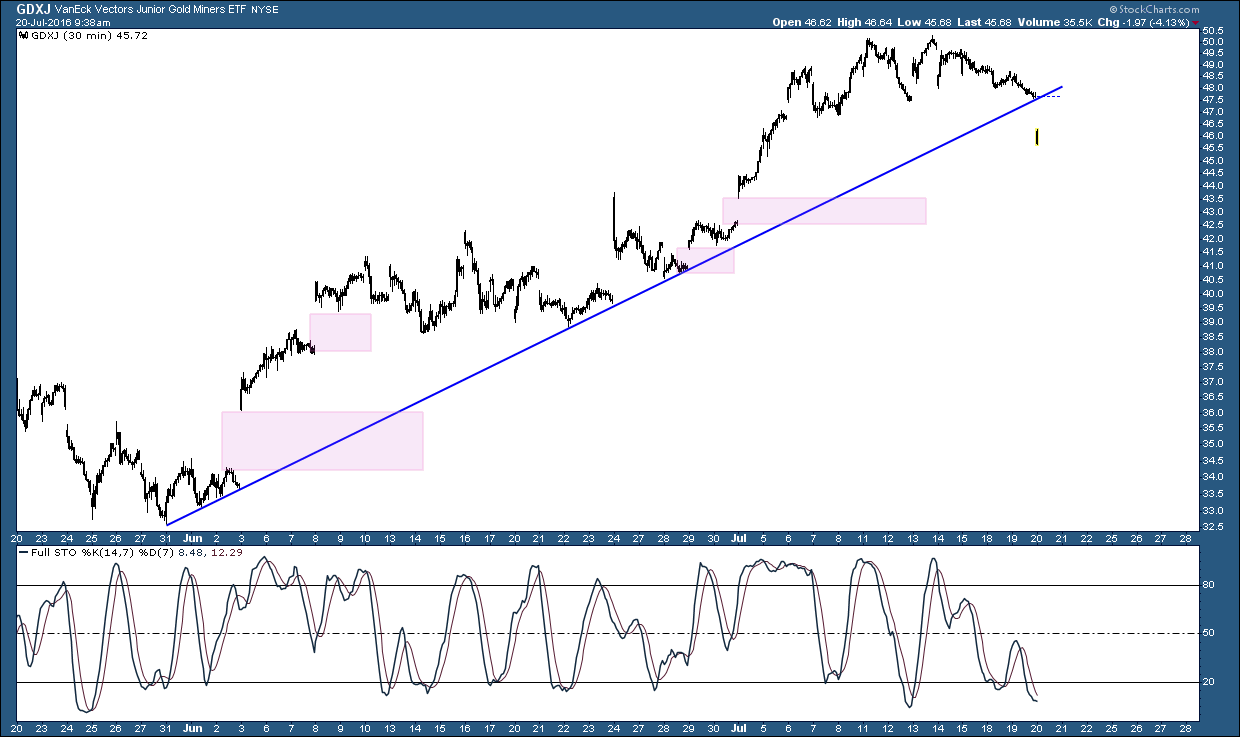
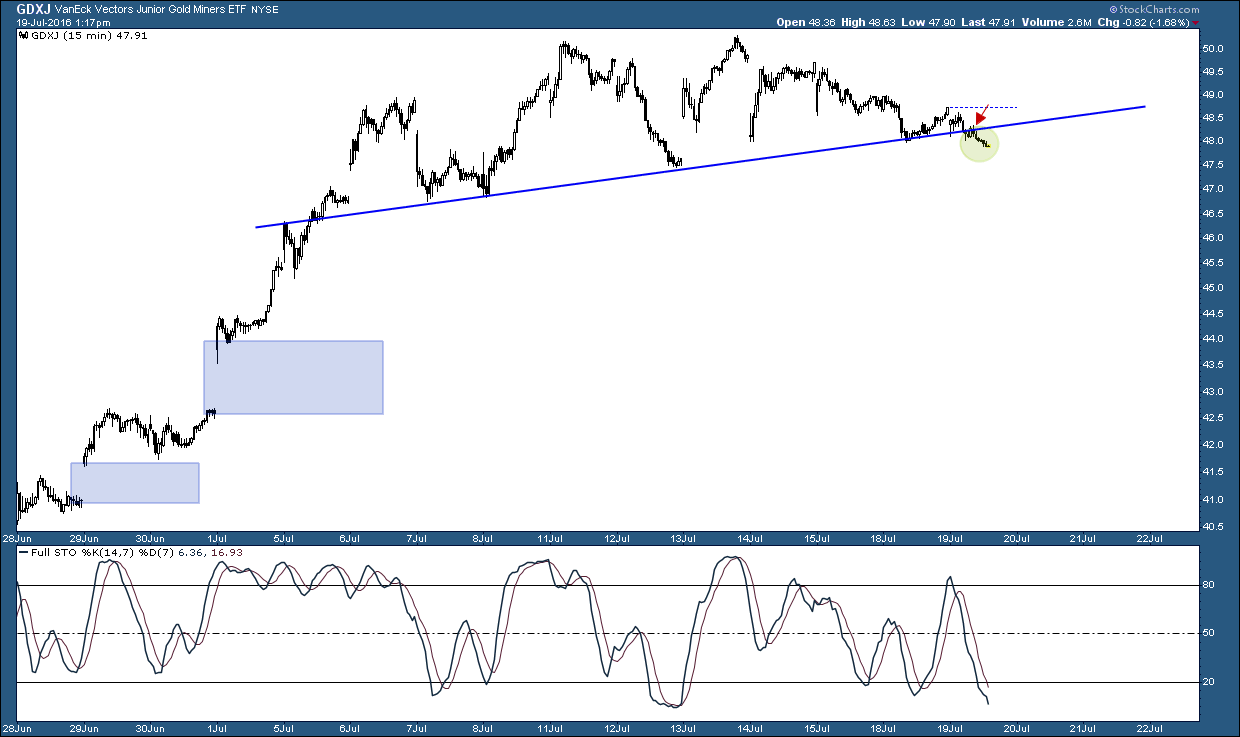
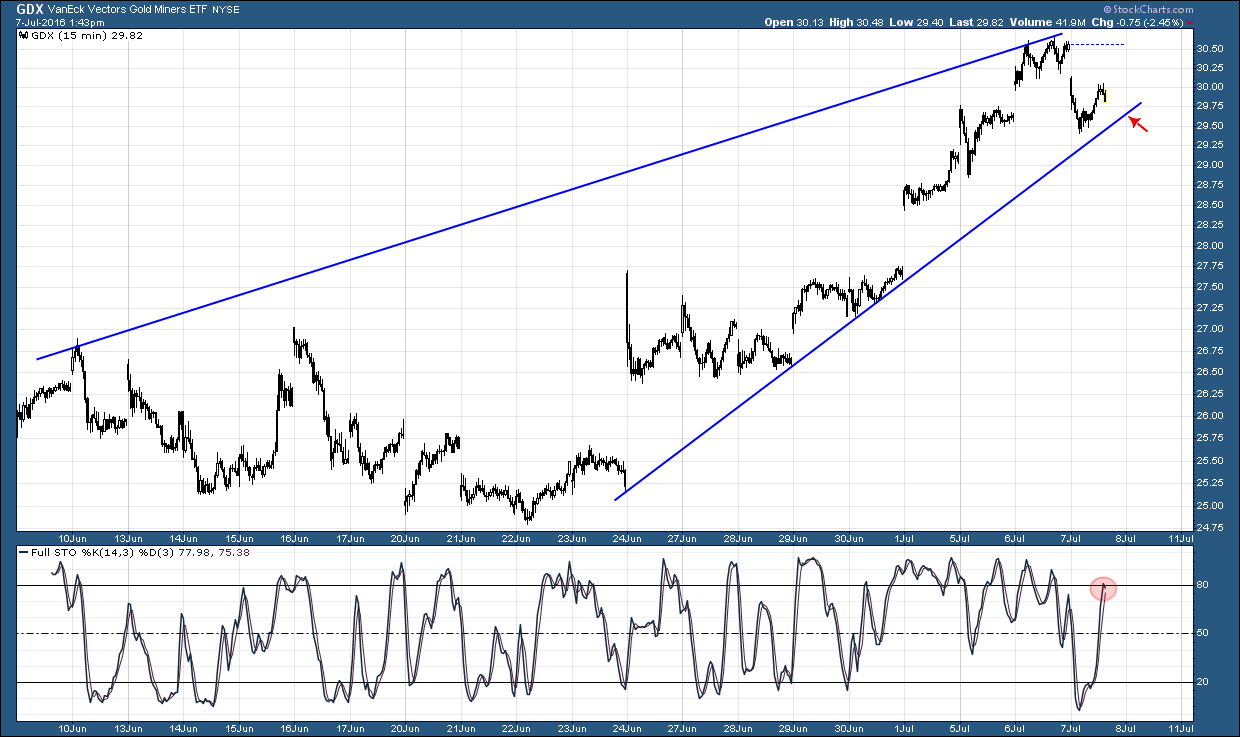
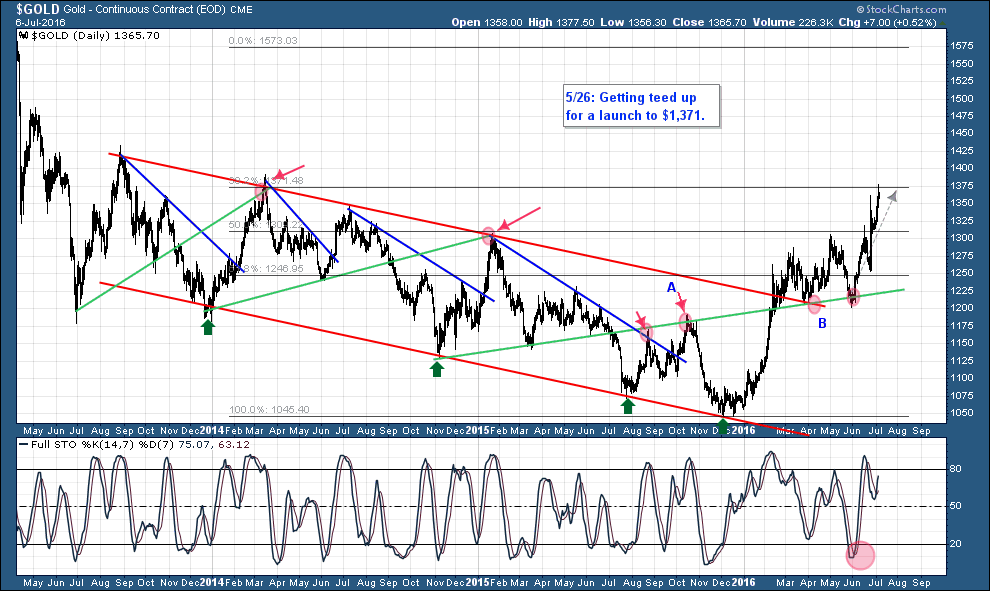
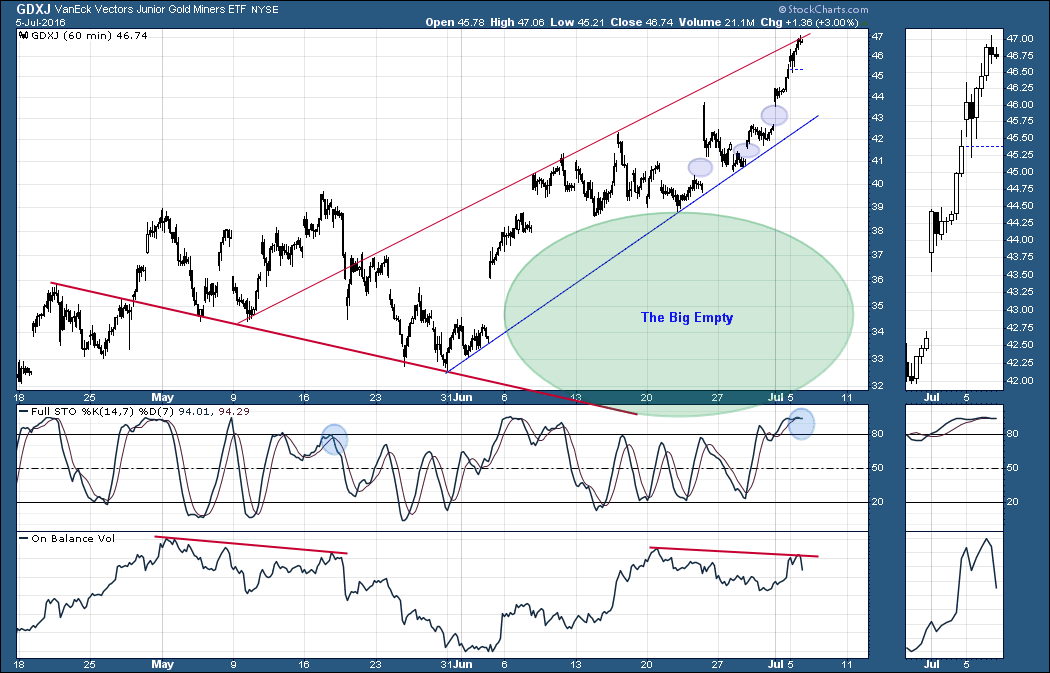
and here’s a GDXJ-based illustration of the type of correction that I think could be in play. Not a trend changer whatsoever but who wants to give up those kinds of gains???? Also, do you guys remember how many folks back in January 2015 swore that the bottom was in????? Turns out they weren’t even close….it was a corrective move.

GDXJ

Yes, I blew this last move!….but….

Amazingly it looks like we are going to retest the same resistance line again in an exhaustion sequence structure similar to what I’m showing in red. If I were still long I couldn’t imagine not selling into this strength with this sort of underlying structure. And yes, I will be buying JDST and DUST on a tag to the line hopefully at the close. Maybe now I’m finally crazy? 😉

GDX

Note: It’s looking like we don’t tag it today so I’m guessing on Tuesday we will gap up to tag the line and then reverse with a black candle just like the last two times….we will see.

If you take a look at intraday JNUG to see what the micro structure of this move looks like heading into resistance on the GDX daily, you can see it doesn’t have much wiggle room. Bought more JDST and DUST into the close but have some dry powder in case we get that gap up Tues morning.

JNUG

Silver Leading Gold???

I’m not buying it. Take a few steps back and get a clearer picture of what’s going on. If silver were matching gold it would be trading at $21 to match the peak resistance gold is facing here.

monthly

S&P Still Bullish

Repost of my 5/19 chart. Nothing bearish about this….above 20ema, bullish broadening wedge (similar to gold last December), and OBV is now at 20-yr high despite pattern not having broken out yet. No divergence, healthy internals, and healthy chart pattern. I don’t know why everyone wants to be short the SM right now.

SPX

By the way I see a typo on the chart. It should read “20ema needs to morph into resistance….”

MUX Example – Distribution

There are so many miner charts right now that show volume distribution from mid-June to now. This divergence is more pronounced than I possibly have ever seen and I don’t think it should be ignored. Plus the bearish wedge fit the volume pattern well. I sold my position too soon but still bagged a quick 50% profit…and from what I recall some of the biggest bulls here were selling some of their MUX positions when I was buying those shares.

MUX

Incidentally, I’m no EW person in the least but at first blush it seems like so many charts like this one (and even the GDX) show a clear 5 wave up structure and are now completing what appears to be an ending diagonal. I’m sure some of EW pros can explain why I’m totally wrong and have no clue how to properly count (which may totally be true!), but I thought I’d throw it out there anyway. Make no mistake, I don’t attempt to use EW in the least but I’m just making a casual observation.

ED

GDX Weekly – I May Finally Be Alone in My View

At long last my Wolfe Wave identified last Dec finally reached it’s target which also equates exactly to a 38.2% retrace from the 2012 high. Yes, I sold the last of my longs into the latest gap up fractionally below what I believe to be the peak and I’m slightly underwater on my short positions (avg JDST cost is $8.98). You can see the tremendous divergence in OBV on this view of the weekly…and this type of divergence rarely gives false signals. The structure is bearish, the internals are bearish, and the levels of resistance are ubiquitous. If this were the Dow or S&P, 99% of you would be citing all the factors I have pointed out as reasons to be short….but alas bias and dollar signs are entering the picture so no one is selling into strength. This time is always different, right?

I suspect prices will pull back from here into the highlighted fib zone. To my eyes, a retrace to the ~$20 zone seems to fit best. It would be a 50% retrace from the Jan low, likely create a bounce off the 50MA, and form a really nice looking right shoulder whose structure could create the breakout setup for a run back to the 2012 highs in the mid $50s.

I’m guessing not a single person agrees with me and I actually draw comfort in that if true. One of the most useful aspects of this forum is gauging this group’s sentiment 😉

GDX